Long-term and Archival Passive Acoustic Monitoring (PAM) Data
Data Management & Storage Best Practices
Author
RWSC Marine Mammal Subcommittee
Published
12/14/22
Introduction
This document was compiled by RWSC Staff at the request of the Marine Mammal Subcommittee with the assistance and input of a PAM Data Management Work Group. Work Group members and reviewers of this document included: Melinda Rekdahl (Wildlife Conservation Society); Anita Murray (Wildlife Conservation Society; now Maine Department of Marine Resources); Erin Meyer-Gutbrod (University of South Carolina); Erica Staaterman (BOEM); Genevieve Davis (NOAA NEFSC Passive Acoustics Research Group); Jordan Carduner (Equinor), Laura Morse (Orsted; now Mainstream Renewables); Scott Carr (JASCO); Aaron Rice (Cornell University); Joel Bell (US Navy); Carrie Wall Bell (NOAA National Centers for Environmental Information (NCEI)).
This is a living document that will be updated by the Subcommittee as practices and technologies advance.
This document is also responsive to the needs and priorities expressed at recent workshops and expert working group proceedings, including:
The purpose of this document is to address the data collection, management, and storage phases of a long-term/archival PAM project to ensure that while numerous individual entities may be deploying, collecting, and analyzing PAM data, the infrastructure and information exists to facilitate future meta-analyses and syntheses of PAM data across the U.S. Atlantic Outer Continental Shelf (OCS). For specific guidance and information regarding PAM systems and their deployment and the PAM capabilities and techniques needed to promote efficient, consistent, and meaningful data collection efforts on local and regional scales, please see the minimum recommendations for PAM usage in offshore wind energy research developed by NOAA and BOEM (Van Parijs et al., 2021). This PAM data management and storage best practices document incorporates by reference many of the specifications and recommendations of Van Parijs et al., 2021. In addition, the multi-year and multi-sector Atlantic Deepwater Ecosystem Observatory Network for the US Mid- and South Atlantic Outer Continental Shelf (ADEON) project developed several standardized measurement and processing methods to ensure that the underwater acoustic measurements made over the course of its project can be compared with other monitoring programs’ data. ADEON data guides and specifications are incorporated by reference throughout this document as well.
This document does not directly address or recommend best practices for deploying PAM for real-time detection of marine mammals for mitigation purposes (Table 1). U.S. federal agencies may provide requirements or guidance for the deployment, interpretation, reporting, and management of real-time mitigation PAM data in association with offshore wind (or other activities/uses) permitting. The data generated from real-time systems used for mitigation (i.e., species detections) may be integrated into PAM data products as part of the final step of the workflow described below, with additional considerations for differences in study design, collection methods, and other data analysis steps.
Table 1. Various purposes for deploying PAM and relevance to this document
Purpose
Real-time PAM
Archival PAM
Considerations for deployment and best practices for data management included in this document?
Mitigation during pile driving or other noise-generating activities
x
No
Vessel strike avoidance
x
No
Ambient noise monitoring
x
x
Yes
Long-term wildlife monitoring
x
Yes
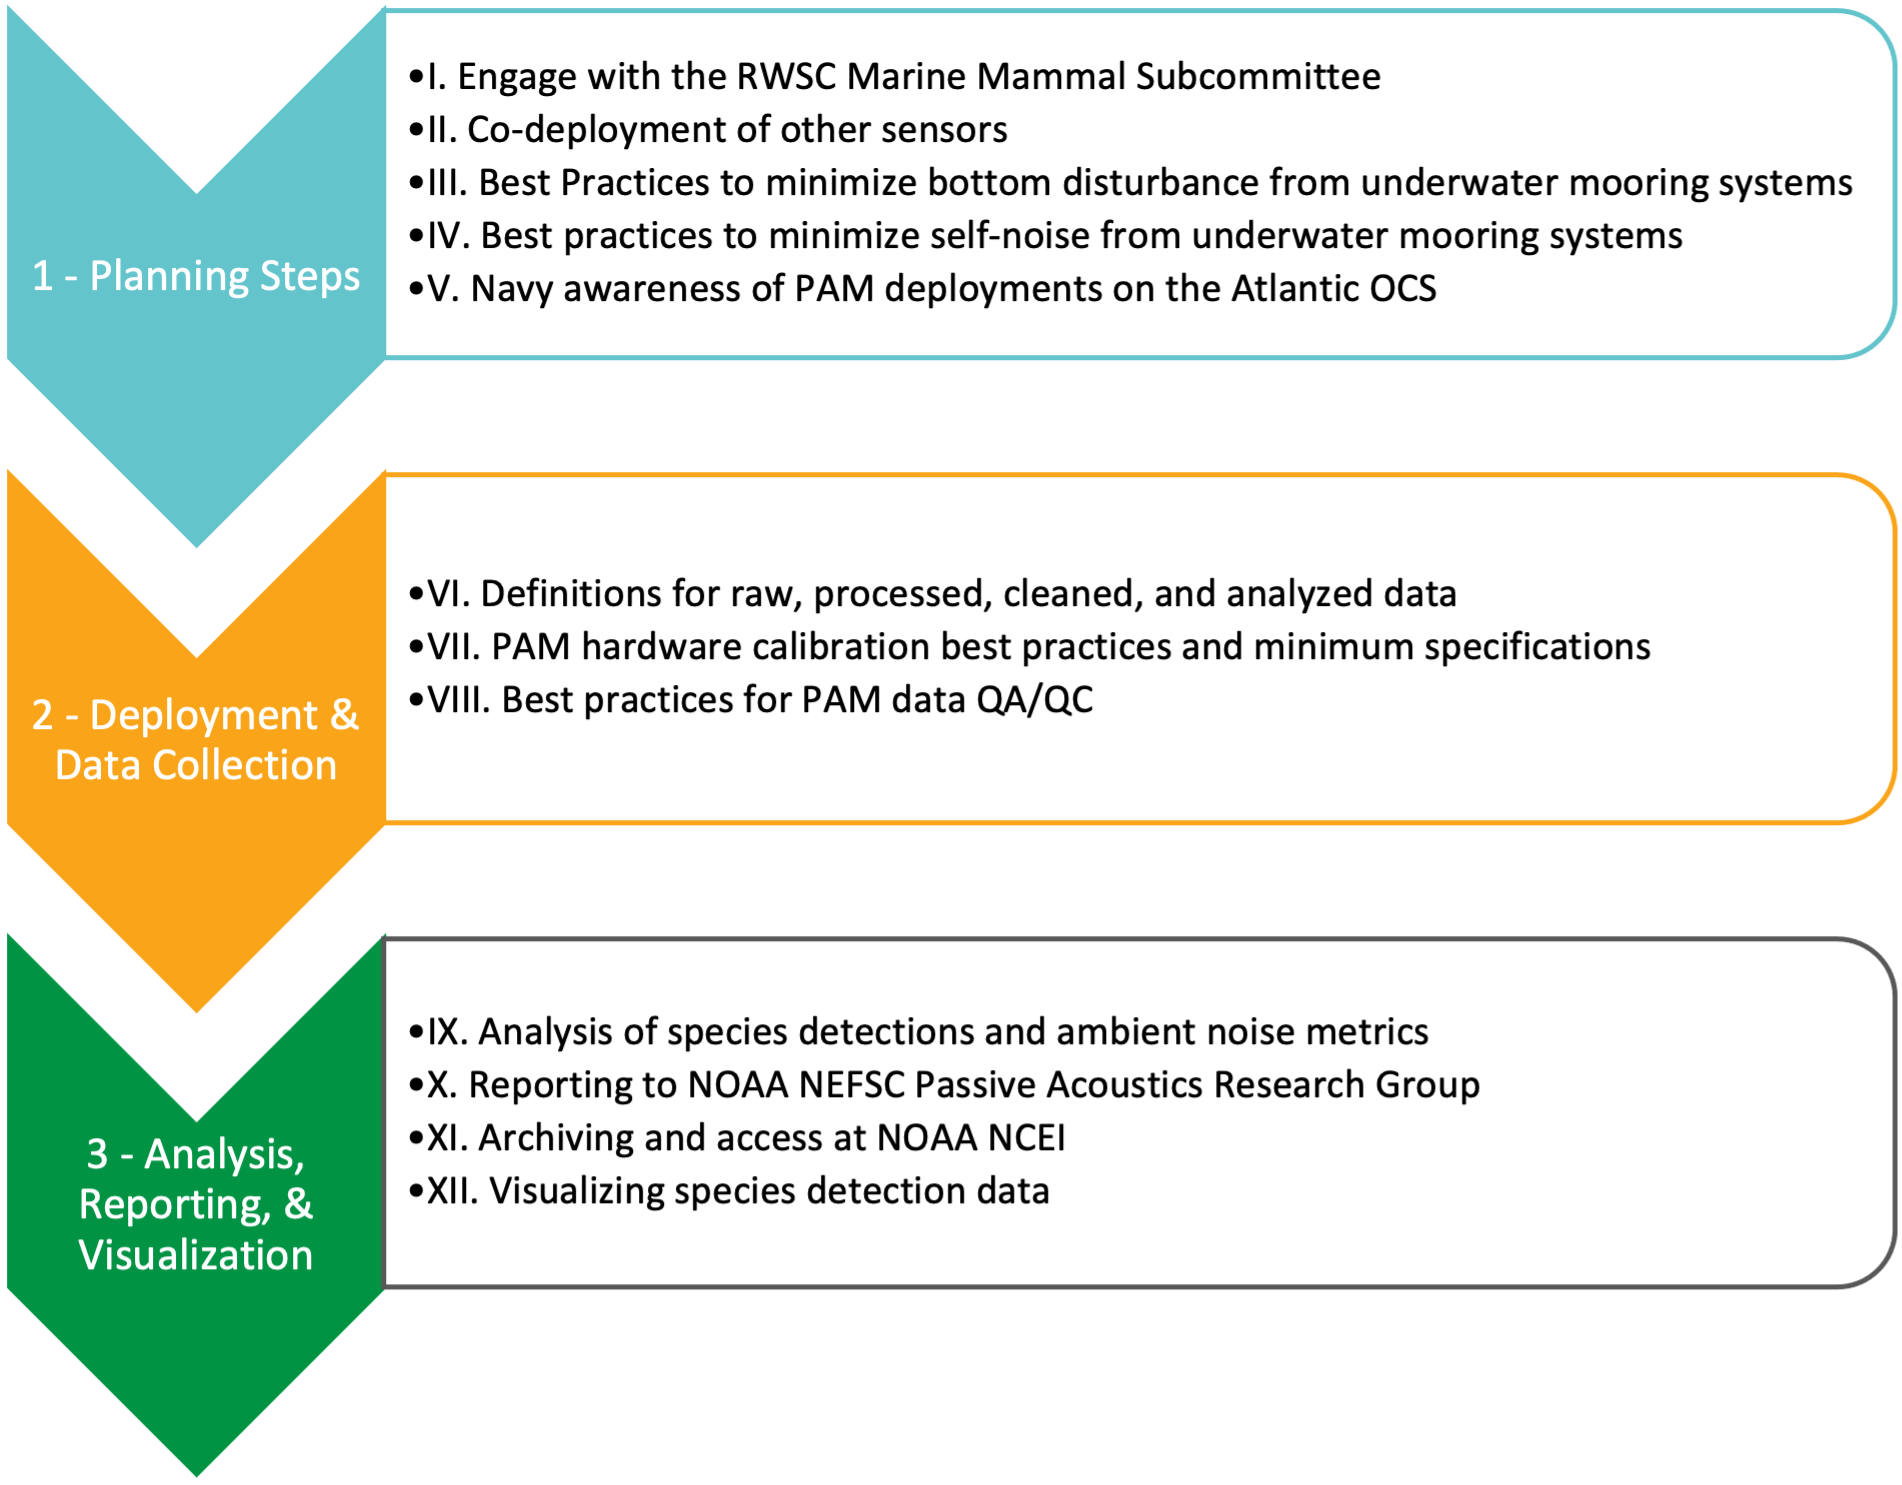
The document is separated into three sections that correspond to a generic workflow for planning, deploying, and analyzing/interpreting long-term archival PAM data, primarily for the purposes of detecting cetaceans. Each section contains several detailed steps that were identified by the RWSC Marine Mammal Subcommittee.
1. Planning Steps
Planning steps include pre-deployment coordination and communication best practices that help ensure that any new deployments are responsive to PAM data gaps and needs in the region (to the extent practicable), and that individuals or entities responsible for deployments and data are connected to the existing network of experts and can benefit from lessons learned and other existing bodies of knowledge.
I. Engage with the RWSC Marine Mammal Subcommittee
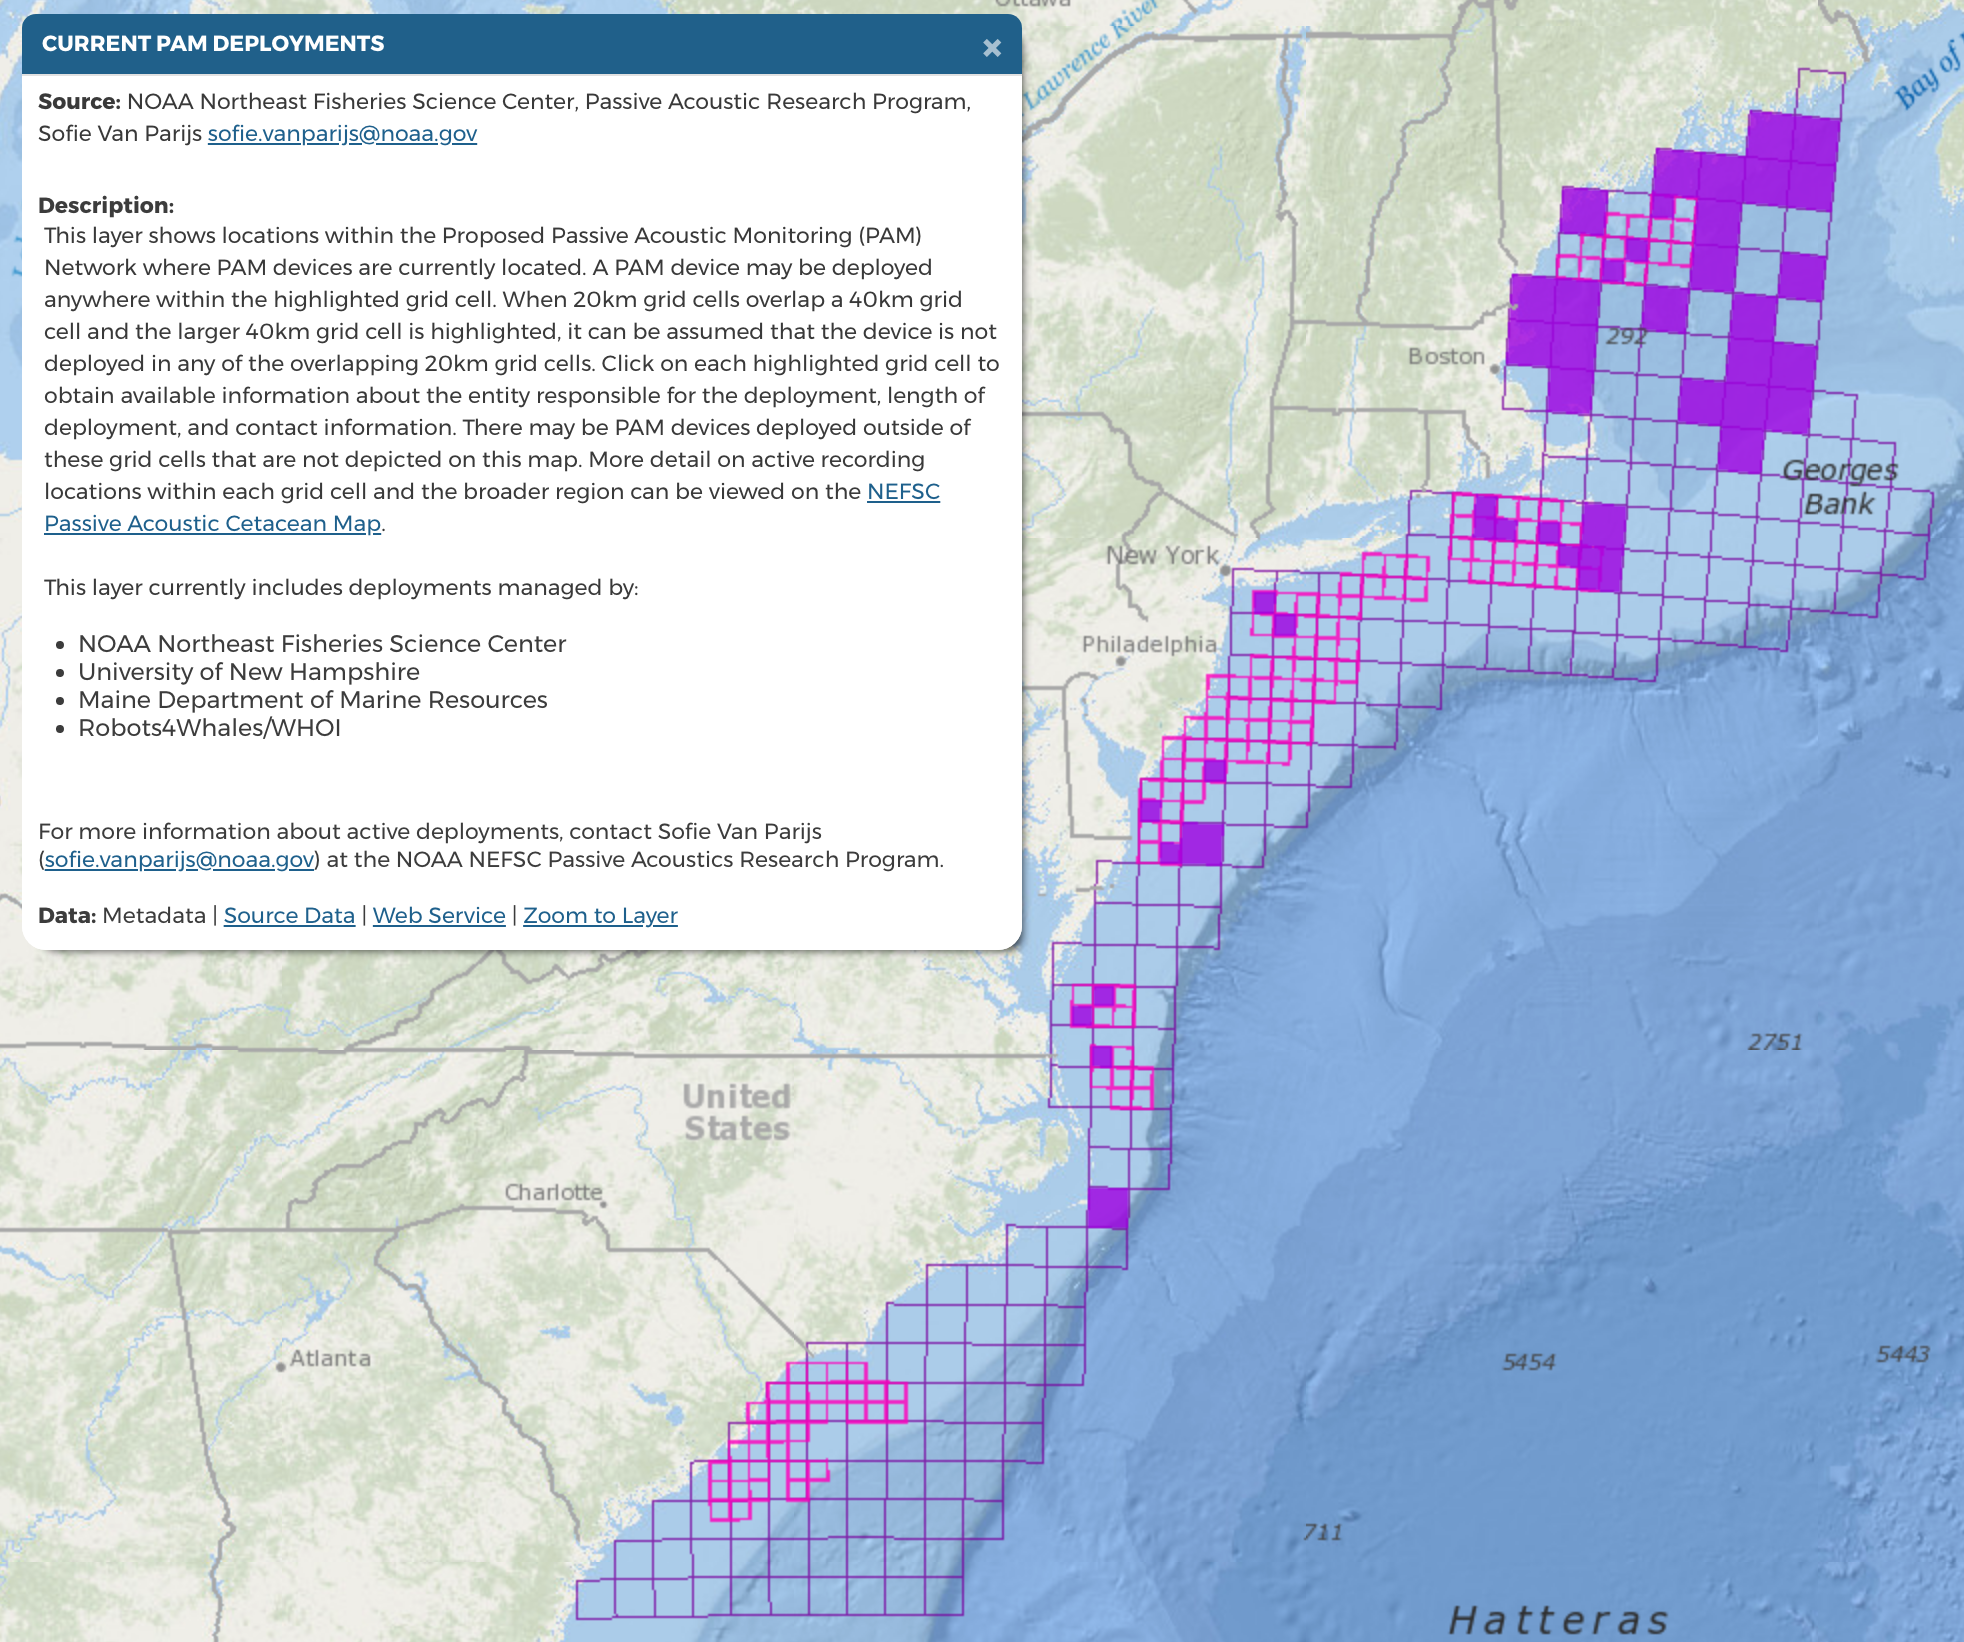
Groups or individuals planning to deploy PAM devices on the Atlantic OCS for the purposes of detecting cetaceans or characterizing ocean noise are encouraged to attend RWSC Marine Mammal Subcommittee meetings to introduce their project, discuss their deployment plan with experts, and receive input on optimal location and other considerations (visit https://rwsc.org/events to view the Subcommittee meeting schedule). In collaboration with the NOAA Passive Acoustics Research Group, the Subcommittee is maintaining an understanding of PAM devices deployed on the Atlantic OCS and periodically updating maps that show current deployments on the Northeast Ocean Data Portal and Mid-Atlantic Ocean Data Portal (see figure below).
Figure 1. The map shows the current PAM deployments in the Atlantic that correspond to the proposed 40km and 20km grid cells that form a potential organizing framework for a regional network (as of August 2022). Grid cells are colored purple if at least one device is located somewhere in the cell. Caveats: there may be more than one device in each cell; there may be devices located outside of the grid cell boundaries.
The Portal maps are developed from location and deployment information shared with NOAA. The following best practices ensure that information about new and completed deployments is shared with NOAA so that the Portal maps maintain their accuracy and relevance.
The Portals also contain data products that may assist funders and researchers in selecting locations for PAM deployment. For example, the Portals contain data products representing monthly and annual vessel traffic for several classes of vessels; commercial fishing activity; offshore wind planning and leasing areas; bathymetry and seafloor composition information; and monthly density model outputs for 29 cetacean species/guilds. The Subcommittee encourages users to examine these data to inform PAM deployment site selection.
II. Codeployment of other sensors
Introducing new PAM instruments and moorings into the environment presents an opportunity to co-locate other sensors and equipment. For example, several active and planned PAM deployments include support for VEMCO receivers or other acoustic telemetry receiver devices. This type of co-deployment builds the receiver network for studies of other taxa such as sea turtles and highly migratory fish species, and is strongly encouraged.
While the location of PAM instruments and moored PAM arrays may not represent ideal receiver locations needed to address research questions answered with acoustic telemetry for other taxa, RWSC and its partners encourage the deployment of multiple sensors per mooring, when practicable, while research questions and best practices for acoustic telemetry are under development.
In August 2022, the RWSC Sea Turtle Subcommittee recommended that acoustic telemetry receivers be included on each new PAM deployment as the RWSC Marine Mammal Subcommittee considers the design and implementation of a regional PAM network.
III. Best practices to minimize bottom disturbance from underwater mooring systems
Participants in the June 2021 BOEM/NOAA Workshop “Improving Monitoring, Data Consistency, Archiving, and Access for Improved Regional Integration of Renewable Energy Science” recommended that best management practices (BMPs) be developed for any moored or bottom-mounted equipment used for mitigation, monitoring, and regional science associated with offshore wind development. These recommended BMPs are intended to address identified issues but are voluntary and should be considered supplemental to any other requirements that may be included under federal or state permits and authorizations. The purpose of the following BMPs is to provide reasonable conditions to avoid ocean use conflicts and minimize any potential environmental impacts associated with scientific devices on or attached to the seafloor.
Review information in ocean data portals and confer with offshore wind developers to ensure device deployment areas do not conflict with existing or planned cable locations, rights of way, or foundation locations.
Properly label all buoys and devices with the responsible operator name and contact information.
Avoid known locations of possible unexploded ordnance (UXO).
Avoid historical or archeological sites.
Avoid known live bottom (corals, seagrasses, etc.) and sensitive hard-bottom features.
Reduce entanglement or entrapment risk to marine protected species.
Utilize ocean data portals and coordinate with offshore wind developers. To the greatest reasonable extent practicable, deployment locations should be deconflicted prior to deploying any research or monitoring equipment on the seafloor. Coordination should occur with offshore leaseholders within lease boundaries and cable rights of way to ensure current or planned development activities do not conflict with the deployment or operation of the device.
Properly label all equipment with the responsible operator name and contact information. Including identification information on equipment will assist with identifying the responsible parties for any equipment that is lost, damaged, or otherwise recovered that is separated from its moorings.
Avoid UXO. Avoidance should be the primary strategy to ensure potential locations of UXO are not interacted with during the deployment, maintenance, and recovery of scientific devices. Information for known ordnance areas are available at https://marinecadastre.gov/data/ and should be checked when identifying potential device locations and prior to equipment re-deployment. New potential UXO may also be identified by geophysical and magnetometer surveys associated with offshore wind data collection.
Avoid known Historical and archeaological sites. If the mooring system, anchoring, or equipment (any portion of bottom disturbance) is to be placed in an area known to be clear or otherwise was previously surveyed and cleared, then no additional surveys are required. If the area was previously surveyed and the equipment is associated with proposed actions under an OCS lease, the lessee should coordinate with BOEM on any necessary requirements under a lease or approval conditions of plans.
Avoid live-bottom features. Mooring systems or equipment sleds should occur at least 150 m from any known locations of threatened or endangered coral species. All sensitive live bottom habitats (eelgrass, cold-water corals, etc.) should be avoided as practicable. Hard-bottom features including pavement, scarp walls, and deep/cold-water coral reefs and shallow/mesophotic reefs as defined in the CMECS Geologic Substrate Classifications) should also be avoided.
Reduce entanglement and entrapment risk. Mooring or retrieval systems should have a discountable risk of entangling or entrapping any marine protected species. Operators should ensure that any buoys attached to the seafloor use the best available mooring systems. Buoys, lines (chains, cables, or coated rope systems), swivels, shackles, and anchor designs should prevent any potential entanglement of listed species while ensuring the purpose, safety, and integrity of the structure or device. All mooring lines and ancillary attachment lines should use one or more of the following measures to reduce entanglement risk: shortest practicable line length, rubber sleeves, weak-links, chains, cables, or similar equipment types that prevent lines from looping, wrapping, or entrapping protected species. Any equipment should be attached by a line within a rubber sleeve for rigidity. The length of the line should be as short as necessary to meet its intended purpose.
IV. Best practices to minimize self-noise from underwater mooring systems
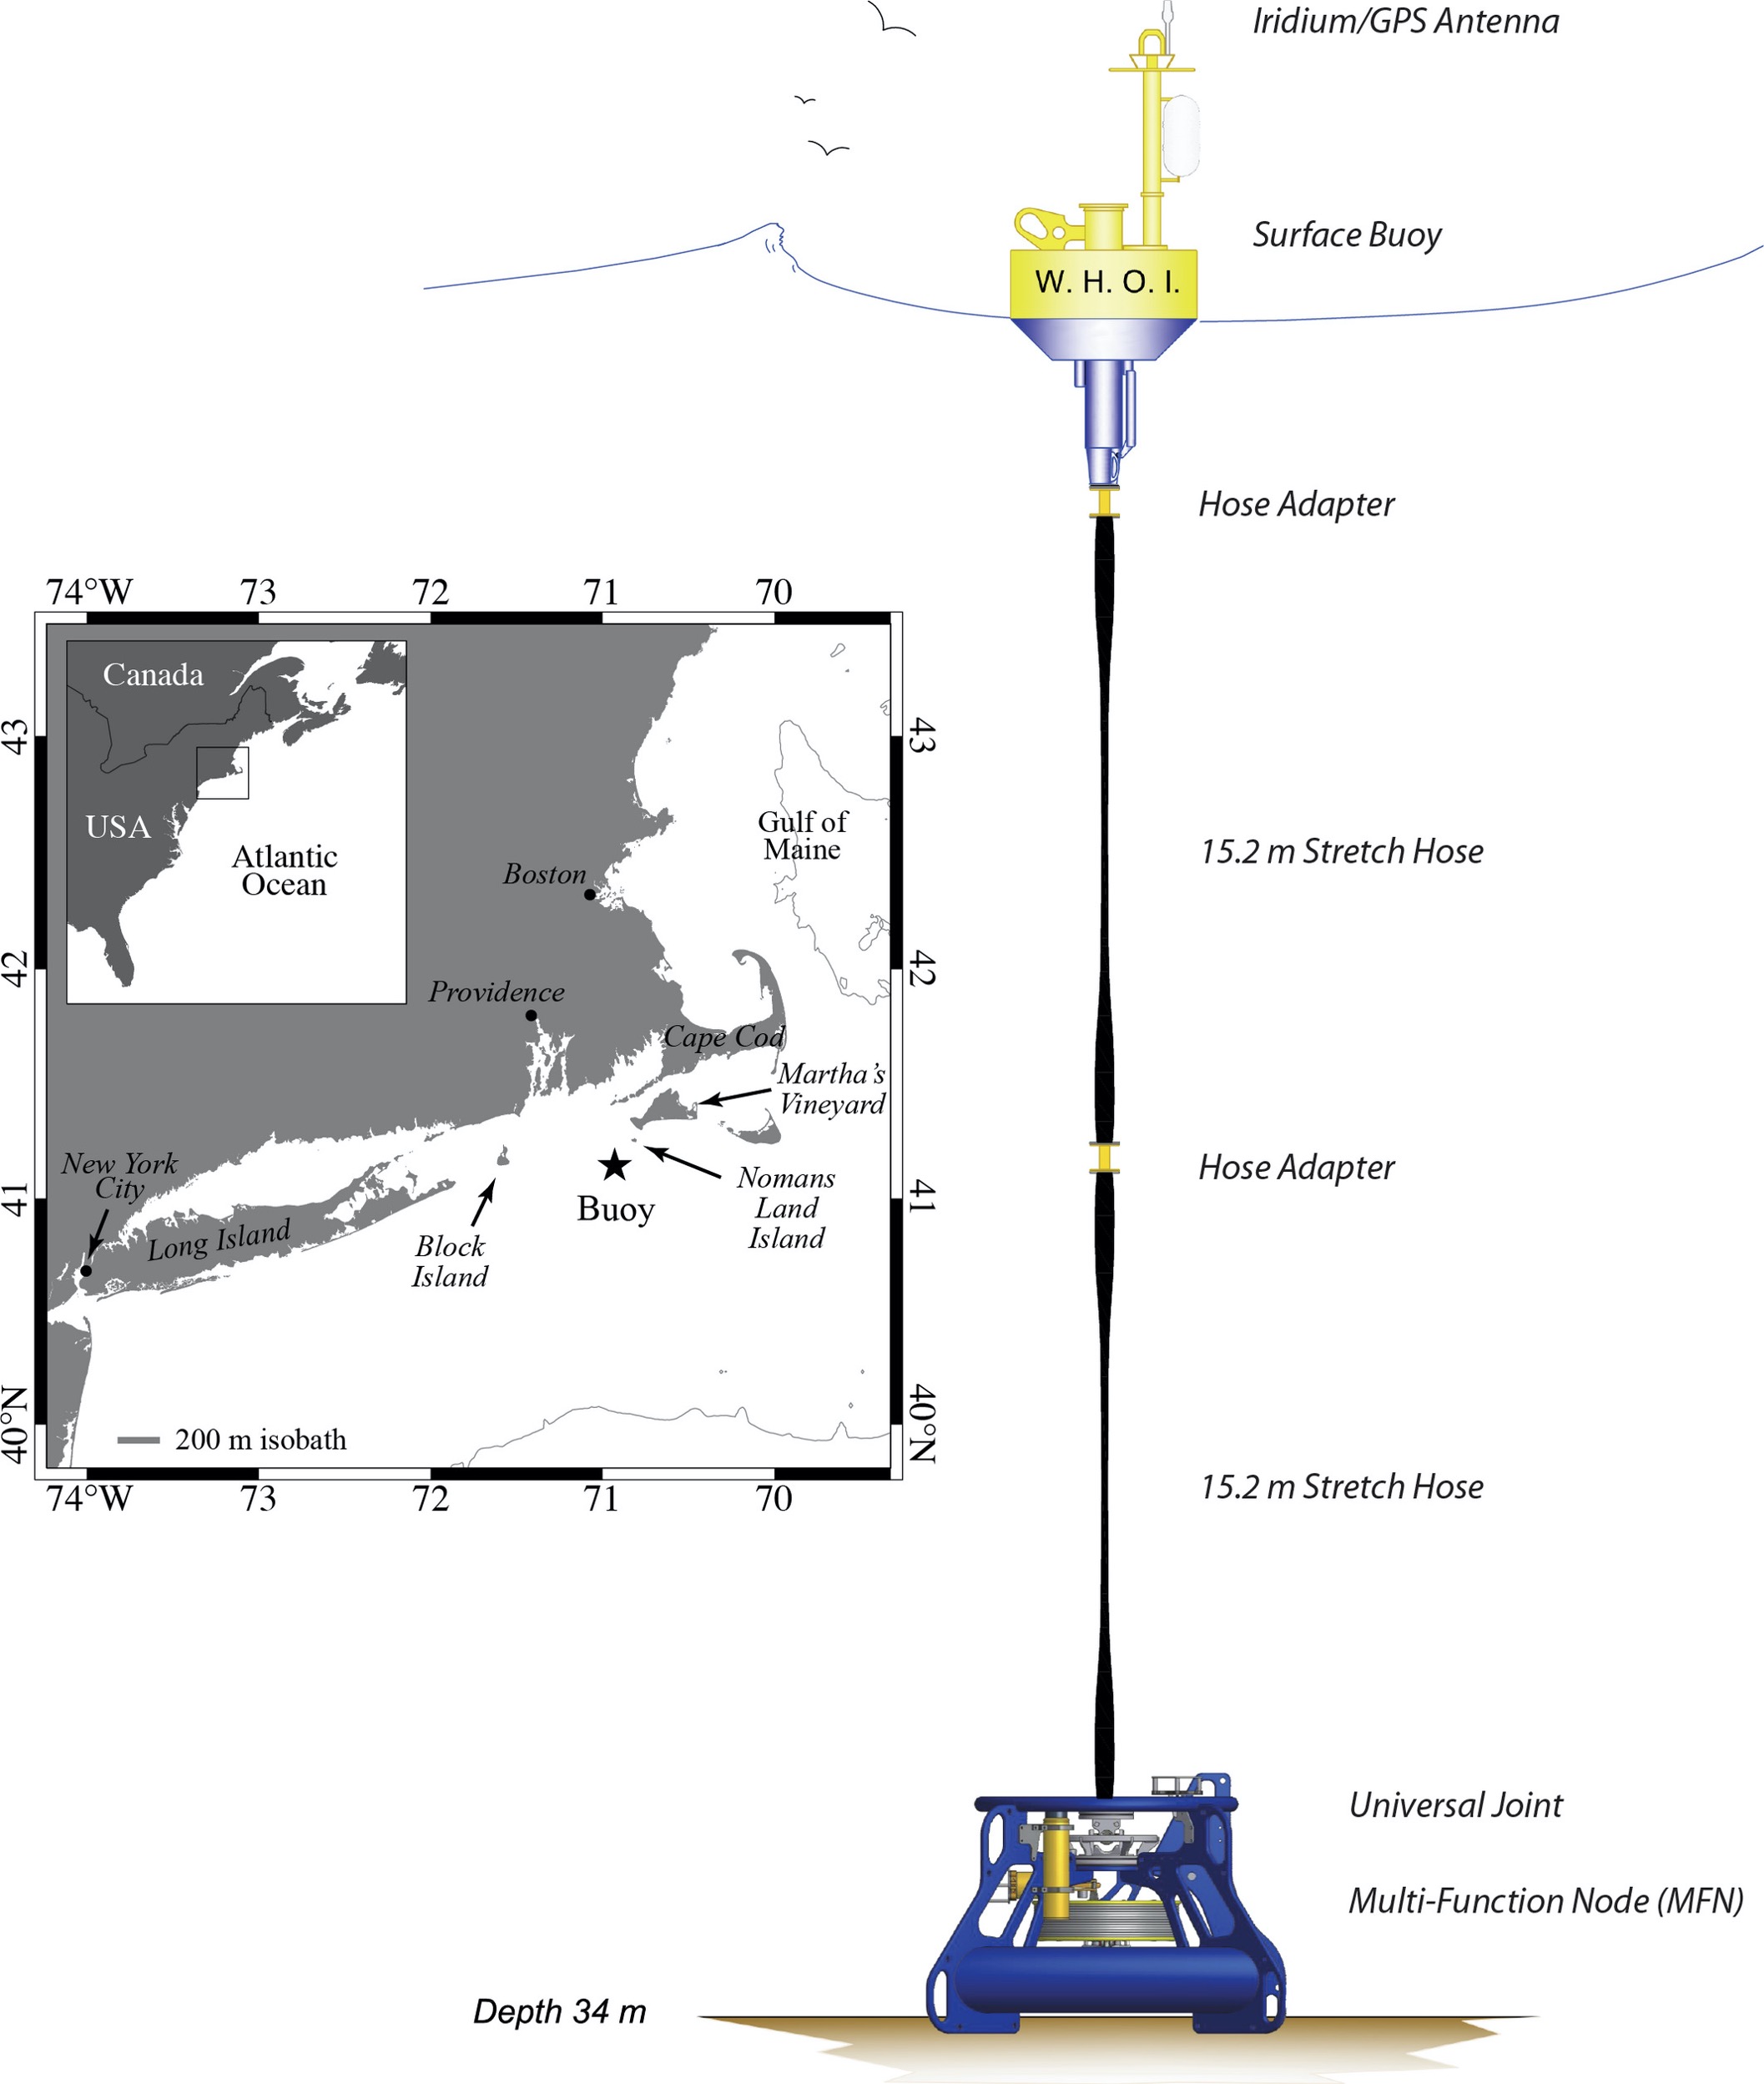
Precautions should be taken to avoid interference of self-noise caused by current flow around the hydrophone and movement of the device and its components. This is especially important in areas with currents greater than 0.1 m/s; to estimate bottom currents for a potential site use the HYCOM model provided by NOAA (https://coastwatch.pfeg.noaa.gov/erddap/griddap/). Flow shields and/or wraps that protect hydrophones and other device components can also be used to decrease self-noise by disrupting the turbulent boundary layers (ADEON Hardware Specification). An example of quiet mooring design is described in Baumgartner 2019:
We utilized a mature mooring design that allowed both quiet operation as well as delivery of digital data from the sea floor to shore (Figure 2.1). The DMON was housed in open cell foam and a urethane fairing and affixed to a bottom-mounted aluminum frame called the multi-function node (MFN), which in turn was attached to the surface buoy by stretch hoses. These hoses can stretch to nearly twice their relaxed length (Paul & Bocconcelli, 1994), thereby absorbing the motion of the buoy in rough wave conditions and keeping the MFN acoustically quiet. The hoses also contain helically wound conductors that allow power and data to be delivered between the buoy and the DMON. The surface buoy contains a platform computer, Iridium and global positioning satellite (GPS) antennas, and a 450-Ahr battery pack to power all system components. The platform computer receives and stores DMON/LFDCS data sent in real-time via the stretch hoses, and once every 2 hours, transmits these stored data to shore via an Iridium satellite modem (Figure 2). The buoy was designed to operate at sea for at least one year.
Figure 2 from Baumgartner 2019.
V. Navy awareness of PAM deployments on the Atlantic OCS
The purpose of the following steps is to ensure that the US Navy is aware of and can provide feedback on the precise location of bottom-mounted archival passive acoustic monitoring equipment on the Atlantic OCS. The Navy is requesting that all individuals consider the following steps prior to deployment. Developers may be subject to additional requirements under the BOEM issued permits.
1. Ensure Navy awareness - 45 days prior to deployment
Submit Passive Acoustic Monitoring (PAM) and/or Distributed Acoustic Sensing (DAS) plan to Navy (latitude/longitude, type, make and model of sensor, water depth, sample rate, time frame, deployment duration etc.). Email Kelsey Rudes: kelsey.a.rudes.civ@us.navy.mil
2. Navy evaluation and response
This step applies to PAM data in all locations, not just BOEM lease areas. Provide at least 30 days for Navy to evaluate the plan from an operational and acoustic security perspective.
Navy Concurs - The Fleet is able to operate with the proposed plan as is. No data screening is needed.
Navy Concurs with requested conditions
Request Alternative Sensor Location: Navy proposes alternative locations that will still allow for original monitoring objectives, while maintaining National Security, Navy training and readiness.
Request Data Screening: Navy would request the ability to screen data from selected sensors and redact potentially sensitive data. The screened data set will be returned to the owner/collector for their unrestricted use and dissemination.
3. Operator confirms sensor deployment locations
After actual sensor deployment, provide precise metadata to Navy within 7 days.
4. Operator data retrieval
If sensor is not identified for screening, operator can proceed with QA/QC and data analysis.
If sensor is identified for requested screening, load data onto hard drives, record metadata about location, water depth, etc.
BEFORE an analyst does any QA/QC, follow existing Navy data handling and secure storage procedures (a detailed document will be provided during step 2 above).
Data will be sent to Navy for screening.
Navy will review and return a redacted data set within 90 days.
Operator can proceed with analysis on the redacted dataset.
5. Instrument recovery/redeployment
Operator will notify Navy if instruments are recovered, and/or redeployed in the same location, or if settings or location have changed, will restart with step 1 above.
2. Deployment & Data Collection
The following sections outline steps in the deployment of PAM hardware and the collection and collating of PAM data. Best practices associated with each step are described, and/or existing resources on the topic are referenced.
This document recognizes that deployment and data collection steps are likely specifically established by entities deploying instruments and collecting data; and in some case these procedures could be proprietary. The following steps outline minimum considerations for ensuring that data being collected by various entities around the region can eventually be collated and analyzed in the future to examine regional-scale questions or issues of interest.
VI. Definitions for raw, processed, cleaned, and analyzed data
It is expected that PAM data are collected to obtain (either or both) species detection information (e.g., cetacean calls) and ambient or other noise information (e.g., ship detections, construction noise, etc.).
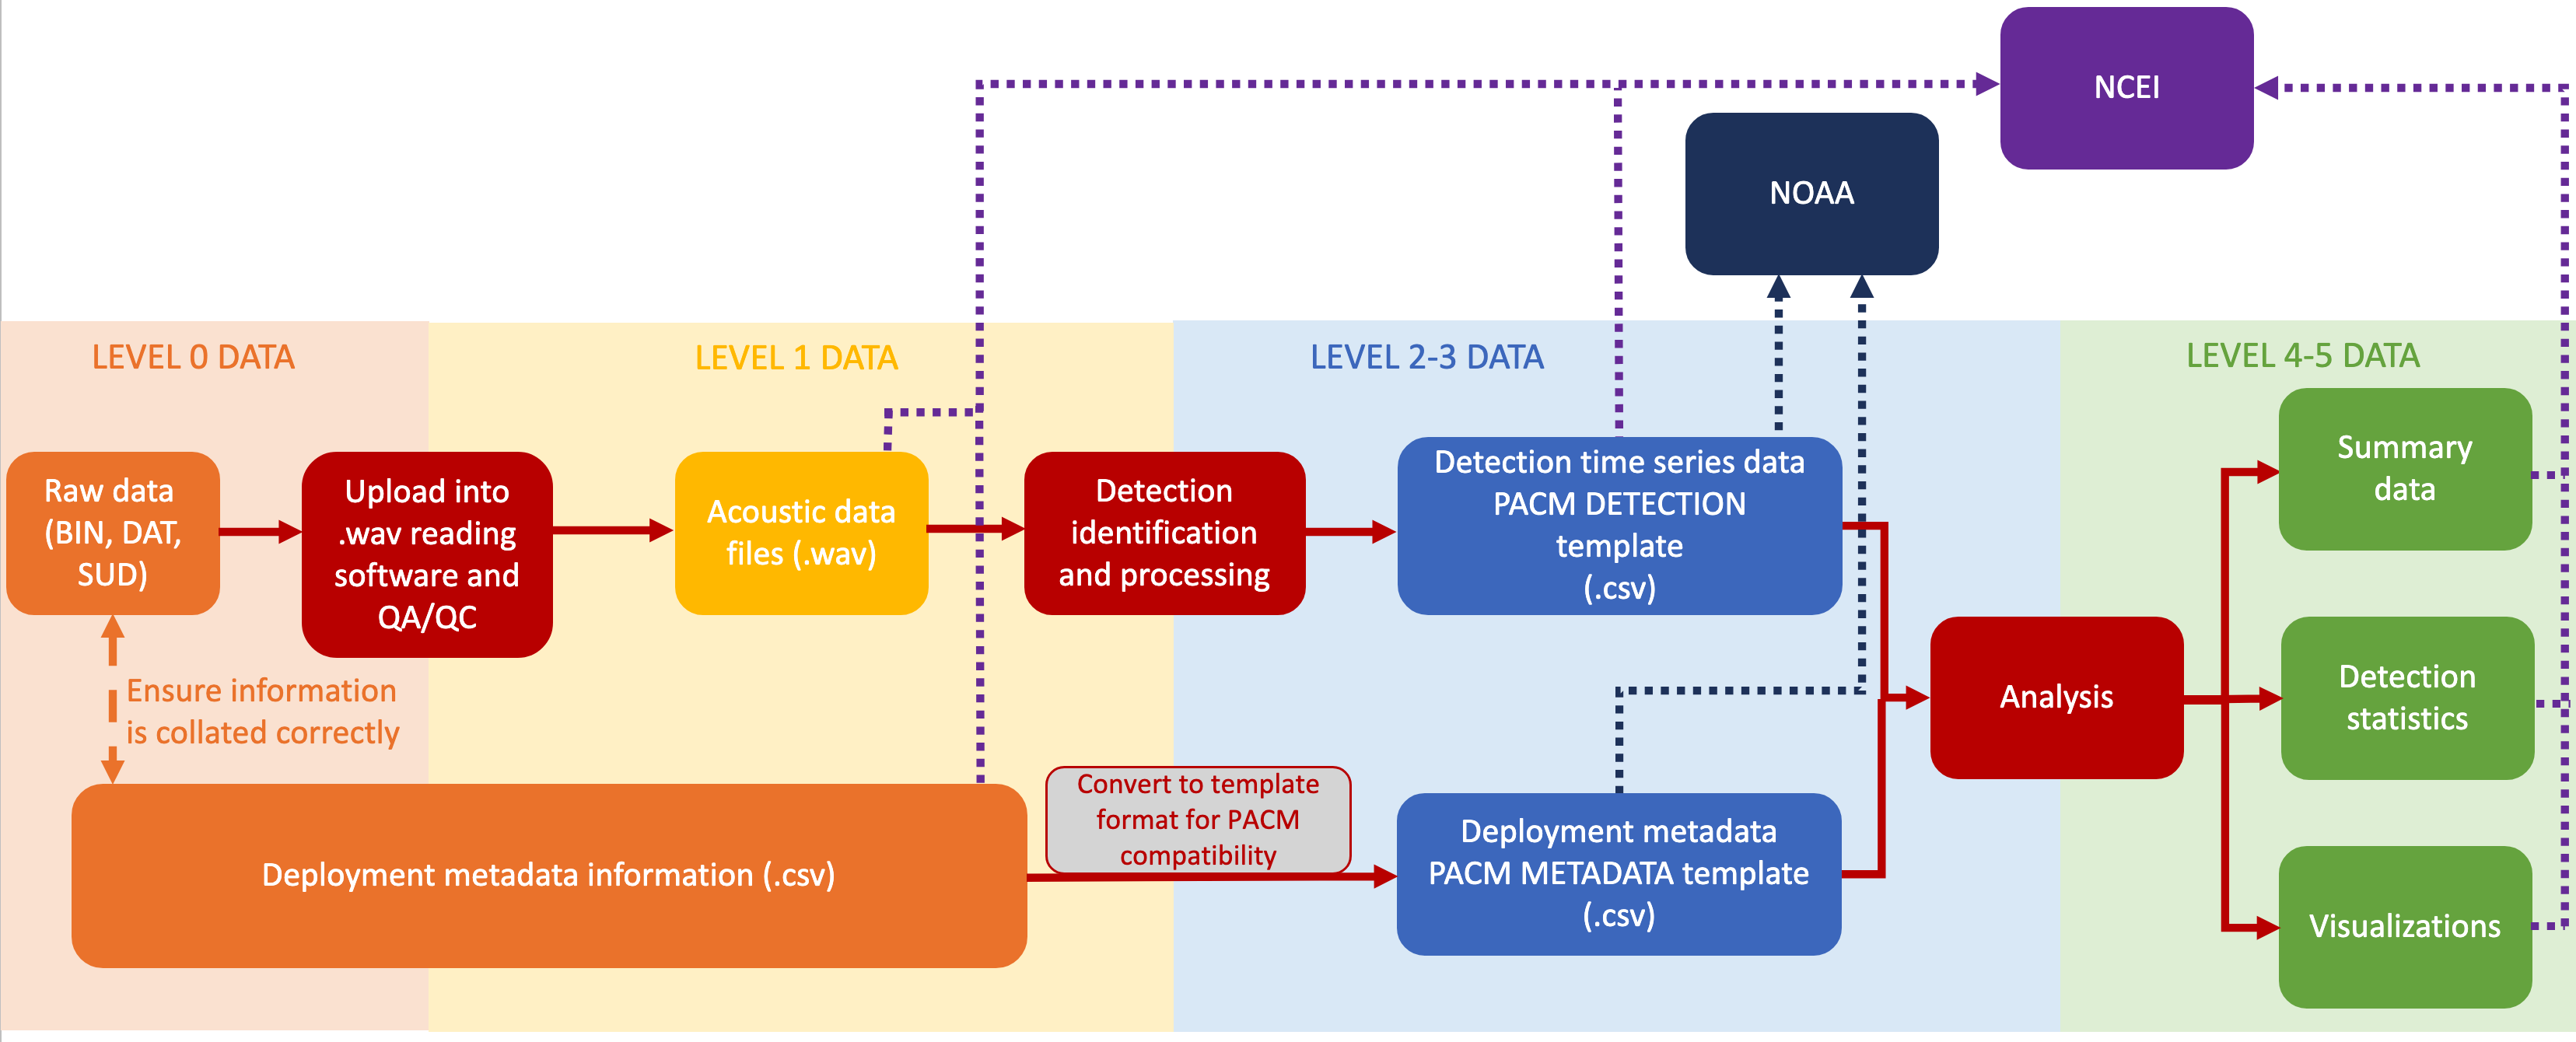
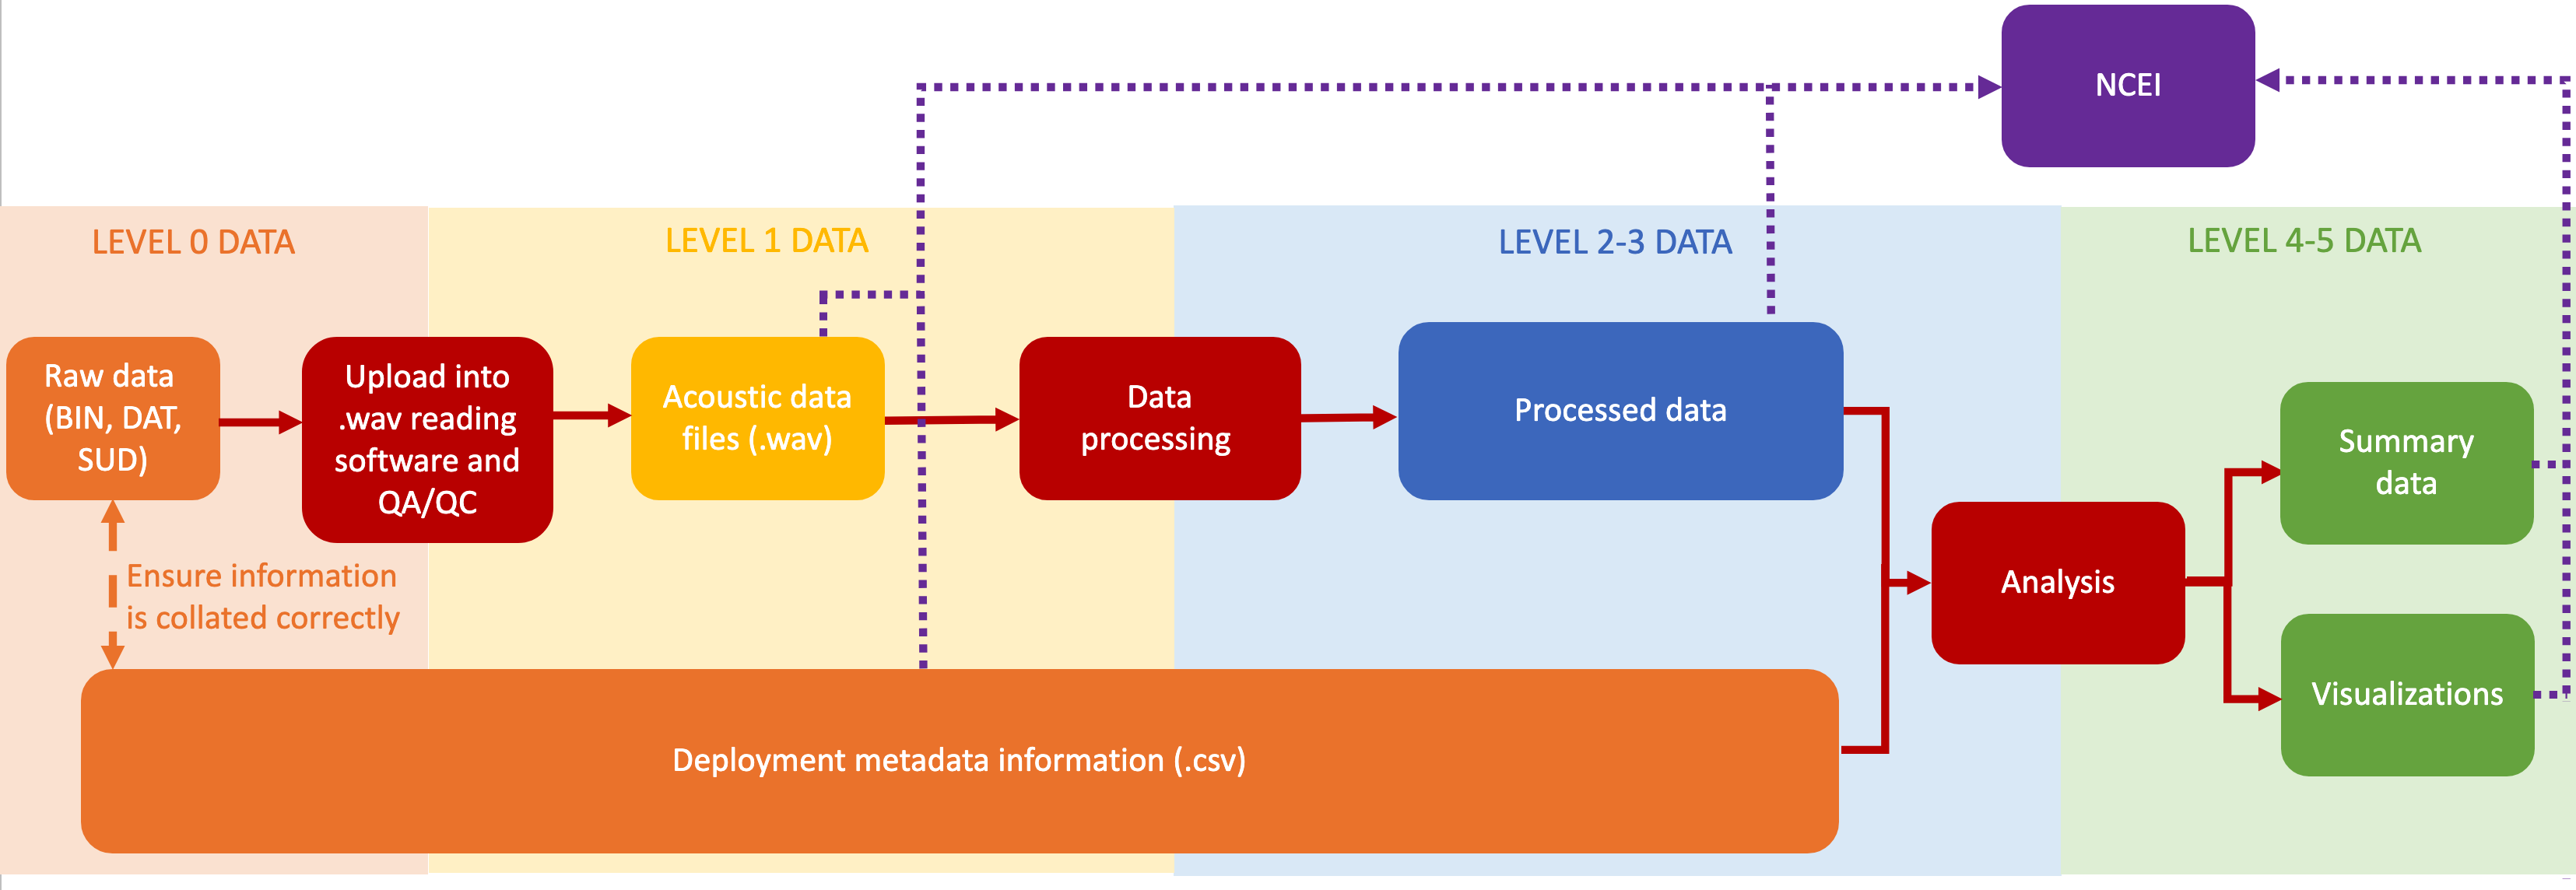
The following data levels (corresponding to the levels described in ADEON’s Data Processing Specification document) apply to both types of information and will be used to define what type of data are being referred to in each of the subsequent sections. These levels correspond to a workflow beginning with raw data downloaded directly from the instrument, to processed, cleaned, and/or analyzed data that have been interpreted to develop data products. There are different specifications and data management steps associated with different parts of the workflow. The grouped levels below are a reflection of when similar specifications and data management steps can be applied.
Table 2. Data levels adapted from ADEON.
Level
Meaning
0
Raw, uncalibrated data; compressed, unpacked data
Examples: binary files (e.g., BIN, DAT) and SUD compressed files; before the calibration information is applied
1
Calibrated time series data
Examples: .wav files (e.g., WAVE, AIFF, FLAC); data processed using software, after calibration is applied; sound pressure on a stationary or moving platform
2-3
Processed data from the calibrated data (quantitative and qualitative). Quantitative processing (temporal or spatial)
Examples: decidecade levels; SEL; depth-integrated data; beamformed data; whale or ship detections/observations; products related to classification of signals; products related to signal localization
4-5
Synthesized products related to soundscape models/maps and predictive habitat modeling. Requires additional information (e.g., AIS, source model)
Examples: interpolated products; marine mammal density estimation
The following flow chart was also adapted from ADEON’s Data Processing Specification document to depict the basic sequence of data analysis and reporting suggested for each data level. The rest of this document provides detailed steps and templates for each part of the workflow.
Figure 2. Flow chart for species detection data.
Figure 3. Flow chart for ambient noise metrics and soundscape characterization.
VII. PAM hardware calibration best practices and minimum specifications
The following steps pertain to pre-deployment best practices for Level 0 data to Level 1 data.
Calibration process
For specific examples and details about PAM hardware calibration, refer to the ADEON Calibration and Deployment Good Practice Guide, which, while limited to the specific instruments used in the ADEON project, is useful regardless of the system being used.
The following text was taken from NOAA and BOEM Minimum Recommendations for Use of Passive Acoustic Listening Systems in Offshore Wind Energy Development Monitoring and Mitigation Programs (Van Parijs et al., 2021) and refers to specific recommended calibration steps.
For all PAM technologies, the hydrophones and related hardware need to be calibrated (every 3 to 5 years) and their performance systematically measured and optimized within frequency bandwidths of interest for the particular activity, species, and environment.
All hardware should be tested and optimized for low self-noise, including the mooring system. In addition to calibration, the system should be fully tested to ensure adequate sensitivity in the area where it will be deployed and with the type of signals it would receive. Additional environmental data will need to be collected to allow for adequate system evaluation. If this cannot be done at the project site, the system should be fully tested in a comparable location (i.e., an area exhibiting similar depth, temperature, substrate, current, acoustic propagation, and ambient noise, with relevant sound sources).
Ideally, the PAM technology used should have been used for the same purpose in other field efforts and have clear and detailed information available about its previous performance and reliability for PAM purposes. If this is not the case, this information needs to be gathered and provided in publicly available documentation as part of the PAM project.
Calibration data and metadata
From NOAA and BOEM Minimum Recommendations for Use of Passive Acoustic Listening Systems in Offshore Wind Energy Development Monitoring and Mitigation Programs (Van Parijs et al., 2021):
Calibration data, and relevant settings and sensitivities should be noted for all hardware used in recording/monitoring to ensure consistency among measurements for particular hardware and software [more detail can be found in Biber et al., 2018]. Array synchronization information (where relevant) should also be documented. This information should be permanently associated with the recordings as metadata.
At a minimum, the following specifications should be measured and reported on:
Bandwidth and frequency response (i.e., 10 to 200 kHz)
System sensitivity (i.e., −207 dB re 1 V/μPa @ 1 kHz) and dynamic range (dB)
System self-noise (i.e., the equivalent bandwidth noise pressure level)
Gain (dB)
Directional response (i.e., omnidirectional or angular dependent)
VIII. Best practices for PAM data QA/QC - (Level 0 data to Level 1 data)
Once hardware is deployed and data are collected, Quality Assurance/Quality Control steps should be taken to ensure integrity of the data. This step is further split into two separate procedures to include actions that should be taken to properly download and check the data from a PAM device as well as the process to QA/QC the data after being downloaded.
Before downloading data from the recorder - (Level 0 data)
For each PAM deployment there should be an associated deployment information file that contains the recording metadata and calibration information as described above in Section VII. Ensure that these data and the acoustic data files match up and are collated correctly prior to deleting any information off of the actual device. For additional detail on post-retrieval field calibration and data handling best practices, refer to the ADEON Calibration and Deployment Good Practice Guide.
After downloading data from the recorder - (Converting Level 0 data to Level 1 data)
The following procedure was provided by NOAA-NEFSC Passive Acoustic Research Group via Genevieve Davis:
Acoustic Recorders
Create standardized project naming system to separate data from each deployment.
Possible naming structure could be as follows:
[RECORDER_ID]_[RECORDING_LOCATION]_[YYYYMMDD of recording start date]_[SITE_NAME]
It may be helpful to create folders that separate audio files from other files (i.e., log, xml files or raw, uncompressed files)
Spot-check sound files:
Load audio files into sound analysis software (i.e., Raven Pro) and check waveform/spectrograms throughout the deployment: at a minimum, beginning, middle, end
Take a listen to make sure all looks/sounds ok
Verify (and/or record) metadata information on sound files in sound analysis software
Check that date/times line up in sound files with what is recorded in metadata sheets for:
Deployment datetime (gmt)
Recovery datetime (gmt)
Recording start datetime (gmt)
Recording end datetime (gmt)
Usable start datetime (gmt) (when recorder is on and in the water- might be at the beginning of no vessel noise after deployment)
Usable end datetime (gmt) (when recorder is no longer on, in the water- might be the start of recovery vessel noise)
Did the recorder stop recording early?
Did the data get corrupted at any point during the deployment?
Clip beginning and end of deployment to remove invalid data
Recordings when recorder is out of water, or corrupted data
Check data for gaps:
Run a gap detector analysis to make note of any gaps in data
Scripts can be written in Matlab, etc., to do this
Check hydrophone recordings/quality
Was hydrophone working properly the whole time?
Good practice to do for all deployments, all recorders. It can help identify instruments that are failing, or data that is corrupted and cannot be used for any or certain analysis such as soundscape metrics, or identify certain frequencies that were compromised by recorder.
Done by calculating TOL (third octave level) metrics:
Example: using scripts (Matlab, etc.) to subsample recordings to look at 1-2 minutes at start of every sound file
If there are other issues discovered that should be looked at more closely too
Additional Instrument Types (Examples)
Active receivers (ex. VEMCO receivers/acoustic releases)
Check to see if there are detections using the chart view in Vue (this is specific for VEMCO receivers) software. Zero detections do not always indicate a problem, but are a good start.
Temperature loggers (internal within a recorder, or external instruments)
Plot data output to make sure nothing looks out of the ordinary
3. Analysis, Reporting, & Visualization
This section provides an overview of steps to ensure consistent analysis of PAM data as well as the data archiving and reporting mechanisms that will be used to maintain a robust centralized archive of PAM data.
IX. Analysis of species detections and ambient noise metrics
(Level 2-3 data)
During this step, Level 1 audio files are interpreted/analyzed and converted into a time series of species detections and/or ambient noise metrics. Van Parijs et al., 2021 provide a comprehensive overview of the hardware and automated software needed for analysis of cetacean calls (species detections) and ambient noise metric measurement.
Species detections
Analyzing calibrated data to derive species detections may be done manually (visually) or using automated software. Standard performance metrics, such as precision, recall, and accuracy, as well as false detection, false positive, false omission and missed detection rates should be provided in the metadata accompanying species detections (Van Parijs et al., 2021). The Subcommittee and other entities (i.e., North Atlantic Right Whale Consortium, NOAA) have identified the need to developed a minimum requirement for the performance statistics to ensure sufficient quality data in these shared resources. However, with those standards still being determined, the following are examples of suggested performance metrics to report for specific project goals: Baumgartner et al., 2021; Kirsebom et al., 2020; Madhusudhana et al., 2020; Gervaise et al., 2021; Kowarski et al., 2020; Kowarski et al., 2021. The ADEON Data Processing Specification also contains a suggested equation for validation of automated detectors and a discussion of how to apply it.
Ambient noise metrics
The ADEON Project uses the word “soundscape” to characterize the ambient sound in terms of its spatial, temporal, and frequency attributes and the types of sources contributing to the sound field. The ADEON Underwater Soundscape and Modeling Metadata Standard suggests several quantitative and qualitative metrics guided by input from the project’s agency sponsors and an international soundscapes workshop.
The following text was taken from NOAA and BOEM Minimum Recommendations for Use of Passive Acoustic Listening Systems in Offshore Wind Energy Development Monitoring and Mitigation Programs (Van Parjis et al., 2021):
Measurements of ambient noise metrics can be carried out using a number of open-source programs such as PAMGUIDE or MANTA. These programs provide a standard series of measurements at the decidecadal level that can be replicated across projects. An ongoing framework inventory on existing standards for observations of sound in the ocean can be found in the Ocean Best Practices Repository.
X. Reporting to NOAA NEFSC Passive Acoustics Research Group
(Level 2-3 data)
Species detection data should be sent to the NOAA Passive Acoustics Research Group using their latest templates for passive acoustic data reporting (current version: 5/25/22) which are based on International Organization for Standardization (ISO) specifications and current research goals. From NOAA and BOEM Minimum Recommendations for Use of Passive Acoustic Listening Systems in Offshore Wind Energy Development Monitoring and Mitigation Programs (Van Parjis et al., 2021):
All confirmed passive acoustic detections of target species/species, whether from archival or real-time data, are archived in a publicly accessible location. For the U.S. East Coast, all species detection data and ambient noise metrics should be reported to the Northeast Passive Acoustic Reporting System via nmfs.pacmdata@noaa.gov. Formatted spreadsheets that follow ISO standards with required detection, measurement, and metadata information are available for submission purposes. When PAM is used for long-term monitoring, all data (detection data, metadata, GPS data, and ambient noise data) should be provided via the formatted spreadsheets and uploaded within 90 days of the retrieval of the recorder or data collection. For further assistance, contact nmfs.pacmdata@noaa.gov.
Submission Instructions
There are three separate files available via the NOAA Passive Acoustics Research Group. Each file contains a template sheet with example data, a sheet with field definitions, and file naming directions:
The NEFSC PACM Metadata template (METADATA) can be used for all data collection efforts (species detections and ambient noise metrics) to ensure consistent data reporting and proper documentation for archival needs.
The NEFSC PACM Detection template (DETECTIONDATA) should be used for PAM systems that contain species occurrence information, and should be accompanied by the associated PACM METADATA deployment template. This ensures that the deployment locations and occurrence information can be displayed on the Passive Acoustic Cetacean Map (which also feeds into the Northeast and Mid-Atlantic Ocean Data Portals). This template also includes a sheet with standardized species codes to use (also included in this document’s Appendix B).
The NEFSC PACM GPS template (GPSDATA) should only be used when collecting data via a mobile platform such as Electric-gliders, wave-gliders, towed-arrays, linear-arrays, drifting-buoys, and tags.
Important Notes
All DATETIME entries should be in the ISO8601 format (YYYY-MM-DDThh:mm:ssZ). The “Z” refers to date time stamps in UTC time zone. See https://en.wikipedia.org/wiki/ISO_8601 for further information on ISO8601 formats and time zones.
In order for the data to be read correctly in the databases, do not use any commas (“,”) in any fields. If there is a need for multiple values (cases explained in field definitions), use a semicolon (“;”). If a comma is necessary, enclose the entire field entry in quotations (“example entry”).
Use of the Species Codes found in Appendix B is strongly encouraged. Contact Passive Acoustics Research Group staff for species codes crosswalk information.
Once formatted and saved as a .csv file the metadata and datasheets should be sent to nmfs.pacmdata@noaa.gov. These data will be displayed on the Passive Acoustic Cetacean Map, and the location information will be shared with the Northeast and Mid-Atlantic Ocean Data Portals. By following these standards, any data collection will also be compatible for NCEI data storage and archival (discussed further below).
XI. Archiving and access at NCEI Passive Acoustic Data Archive
(Level 1-3 data)
The NOAA National Centers for Environmental Information (NCEI) Passive Acoustic Data Archive hosts over 200TB of audio files and data products and is growing quickly. The archive team developed the PassivePacker software tool to simplify data submission to the archive. The software packages the data into standardized structures and creates machine-parsable JavaScript Object Notation (JSON) metadata records. Data providers then send these data packages to NCEI. There is a ~$145/TB cost associated with archiving data at NCEI to support long-term data stewardship that meets the National Archives and Records Administration standards. Quality control and proprietary procedures are dependent on the source of the data and are detailed on the NCEI Archive page.
Archived passive acoustic datasets are made publicly available for search, discovery, and access through a web-based map viewer. Contact pad.info@noaa.gov for information about data archiving, archive costs (which are subject to change), the submission process, and data access.
Submission Instructions
Raw and calibrated PAM data should be archived at NCEI (Level 1 data). All of the species detection/occurrence data and information submitted to the NOAA Passive Acoustics Research Group and as described in the previous Section X are also compatible for submission to the NCEI passive acoustic data archive (Level 2-3 data). In addition, ambient noise metrics data especially should be archived at NCEI (Level 2-3 data).
Please reference the PassivePacker webpage, including a manual found under ‘Help’, for comprehensive data submission guidance specific to passive acoustic data. In order to ensure the most up-to-date records, it is requested that data be sent to NCEI within a year of retrieval. If an embargo is needed past that time to delay public access until after publication, NCEI may be able to provide that service. These exceptions are dealt with on a case-by-case basis.
Important Notes
Storage at NCEI requires the archiving of several items:
The acoustic sound recordings, which are the .wav sound recordings (i.e., Level 1 data) made using the PAM technology, should be compressed into a standardized lossless format such as FLAC for archiving.
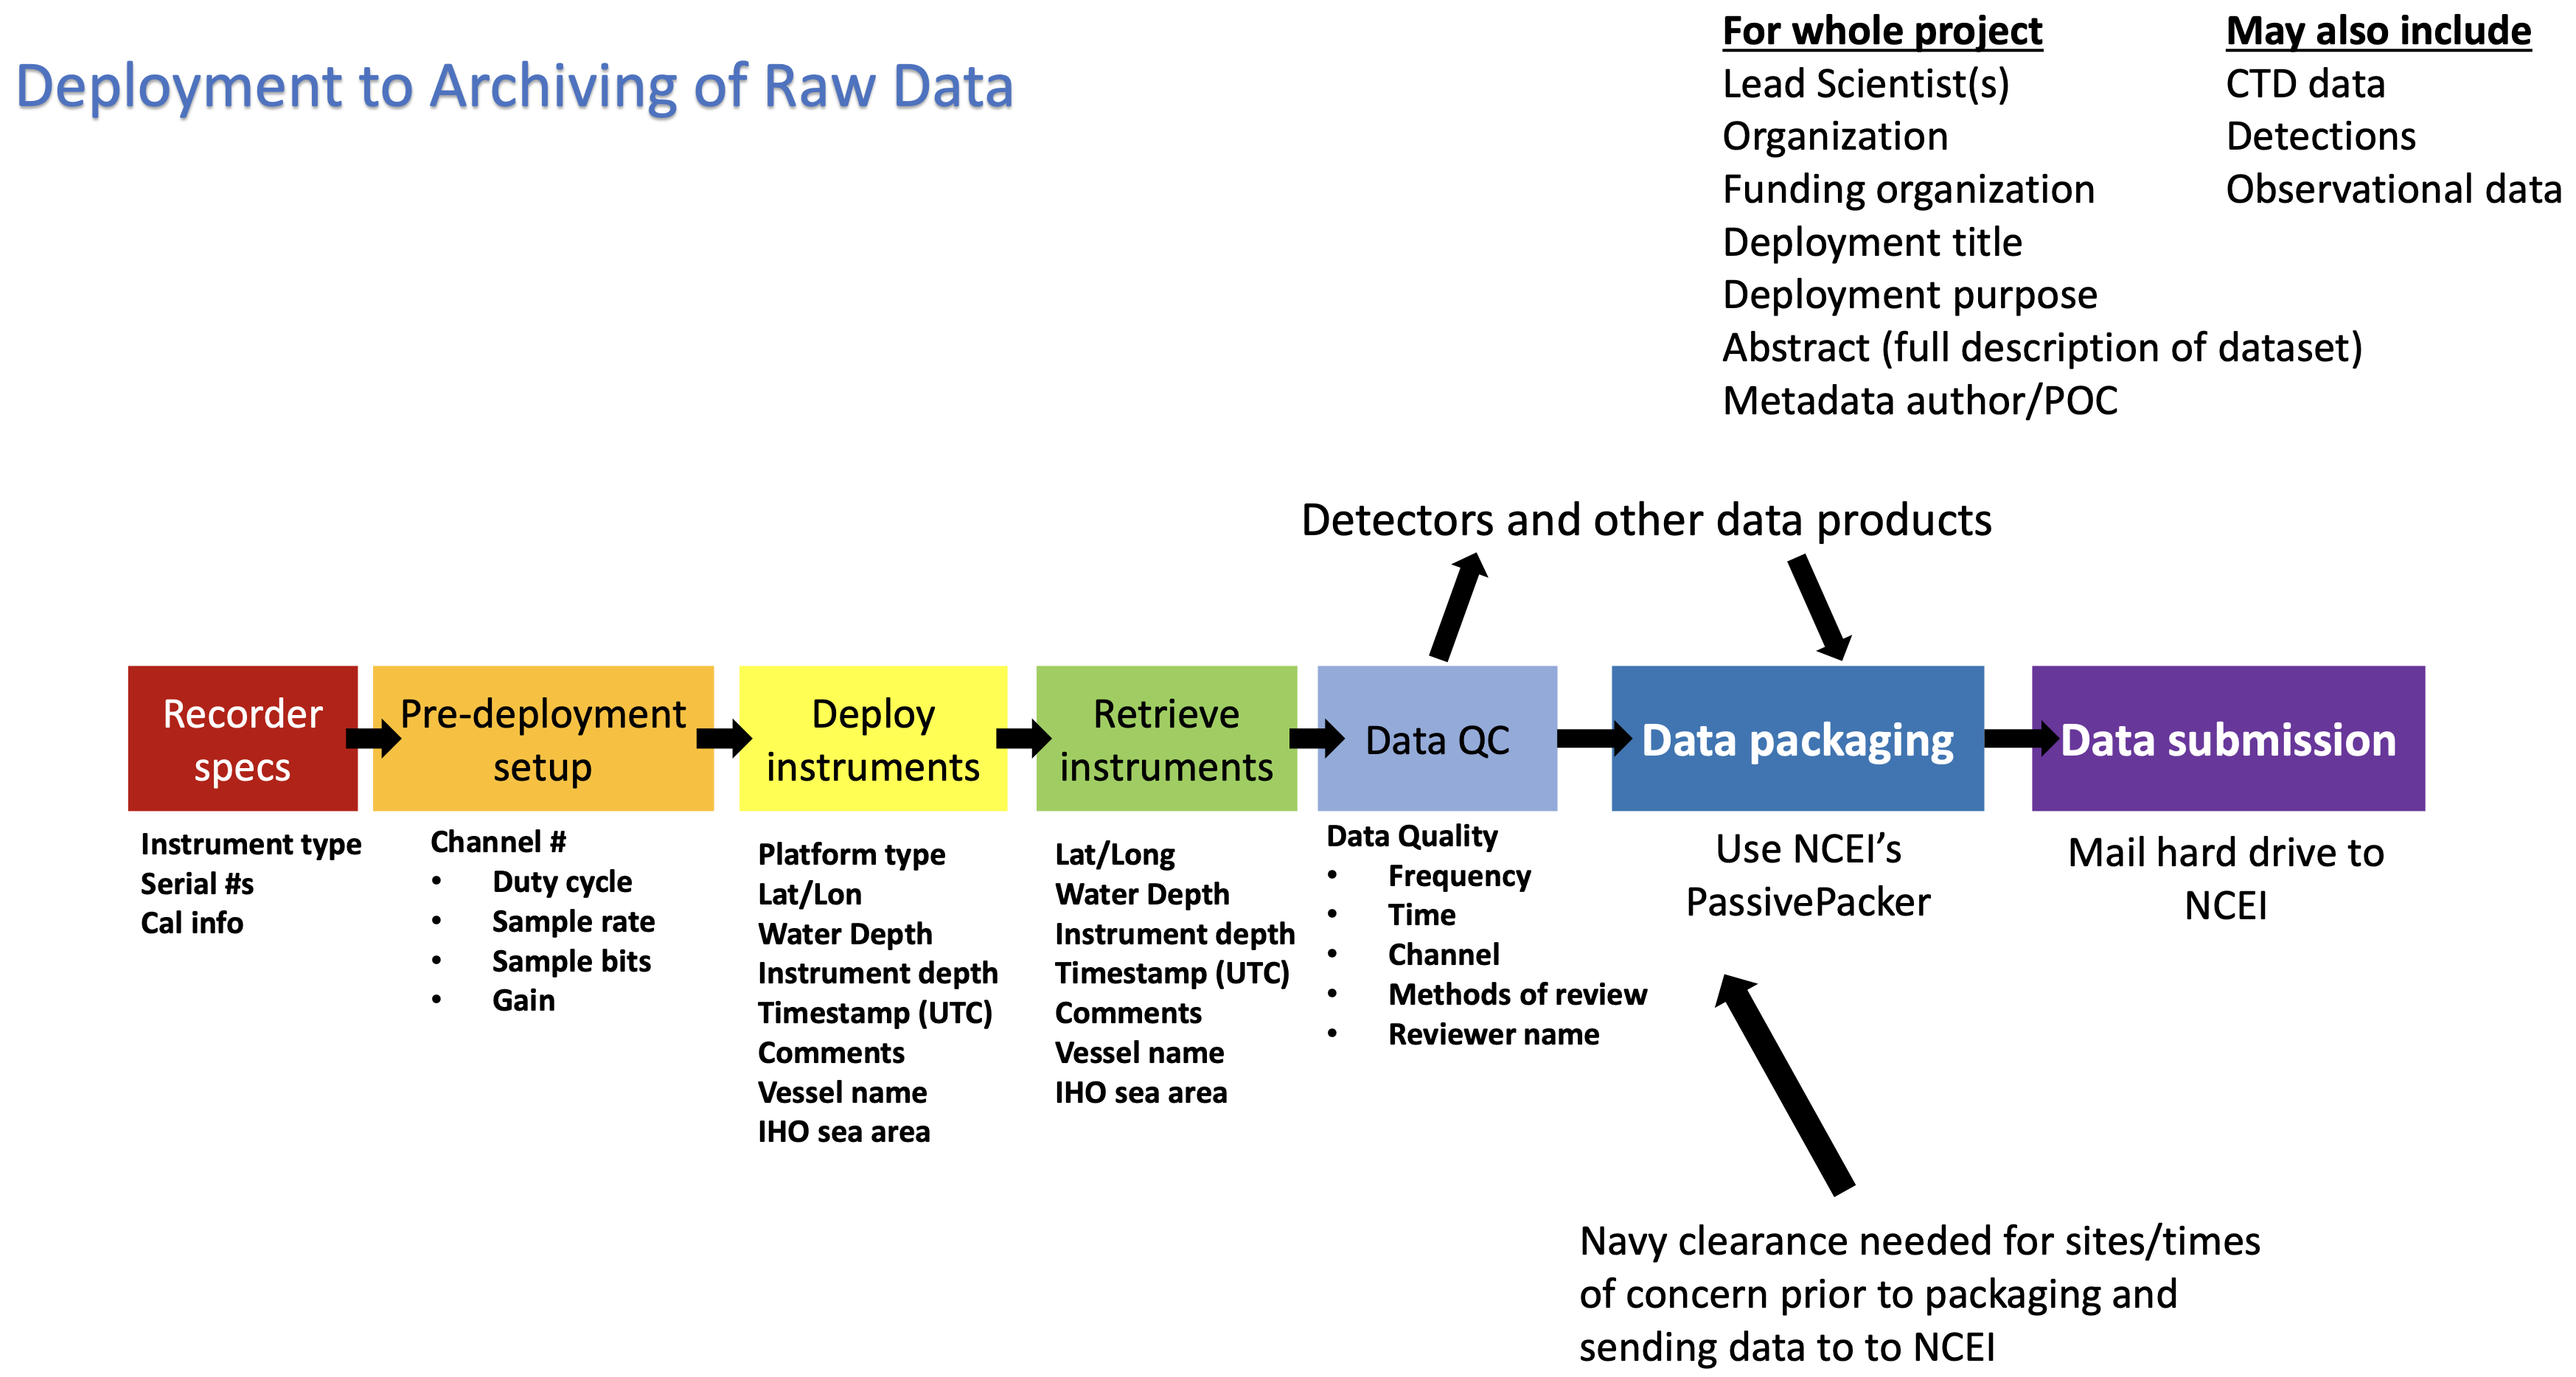
The associated metadata, which is the information associated with the deployment and retrieval of the PAM technology at sea (e.g., recorder type, depth, location, and functionality) and information on the recording settings, such as the sampling rate and recording schedule. The NEFSC PACM Metadata template can be used to organize this information, and PassivePacker contains an interface for entering the various Deployment Information, Instrument type and ID, Sampling, Data Quality, and Sensor Details to generate a metadata record which is also exportable (see the PassivePacker user manual). The figure below lists the types of metadata that should be recorded, entered, and transmitted to NCEI via PassivePacker for each step of a PAM Project.
Figure 4. The types of metadata that should be recorded, entered, and transmitted to NCEI via PassivePacker for each step of a PAM project.
XII. Visualizing species detection data
(Level 4-5 data)
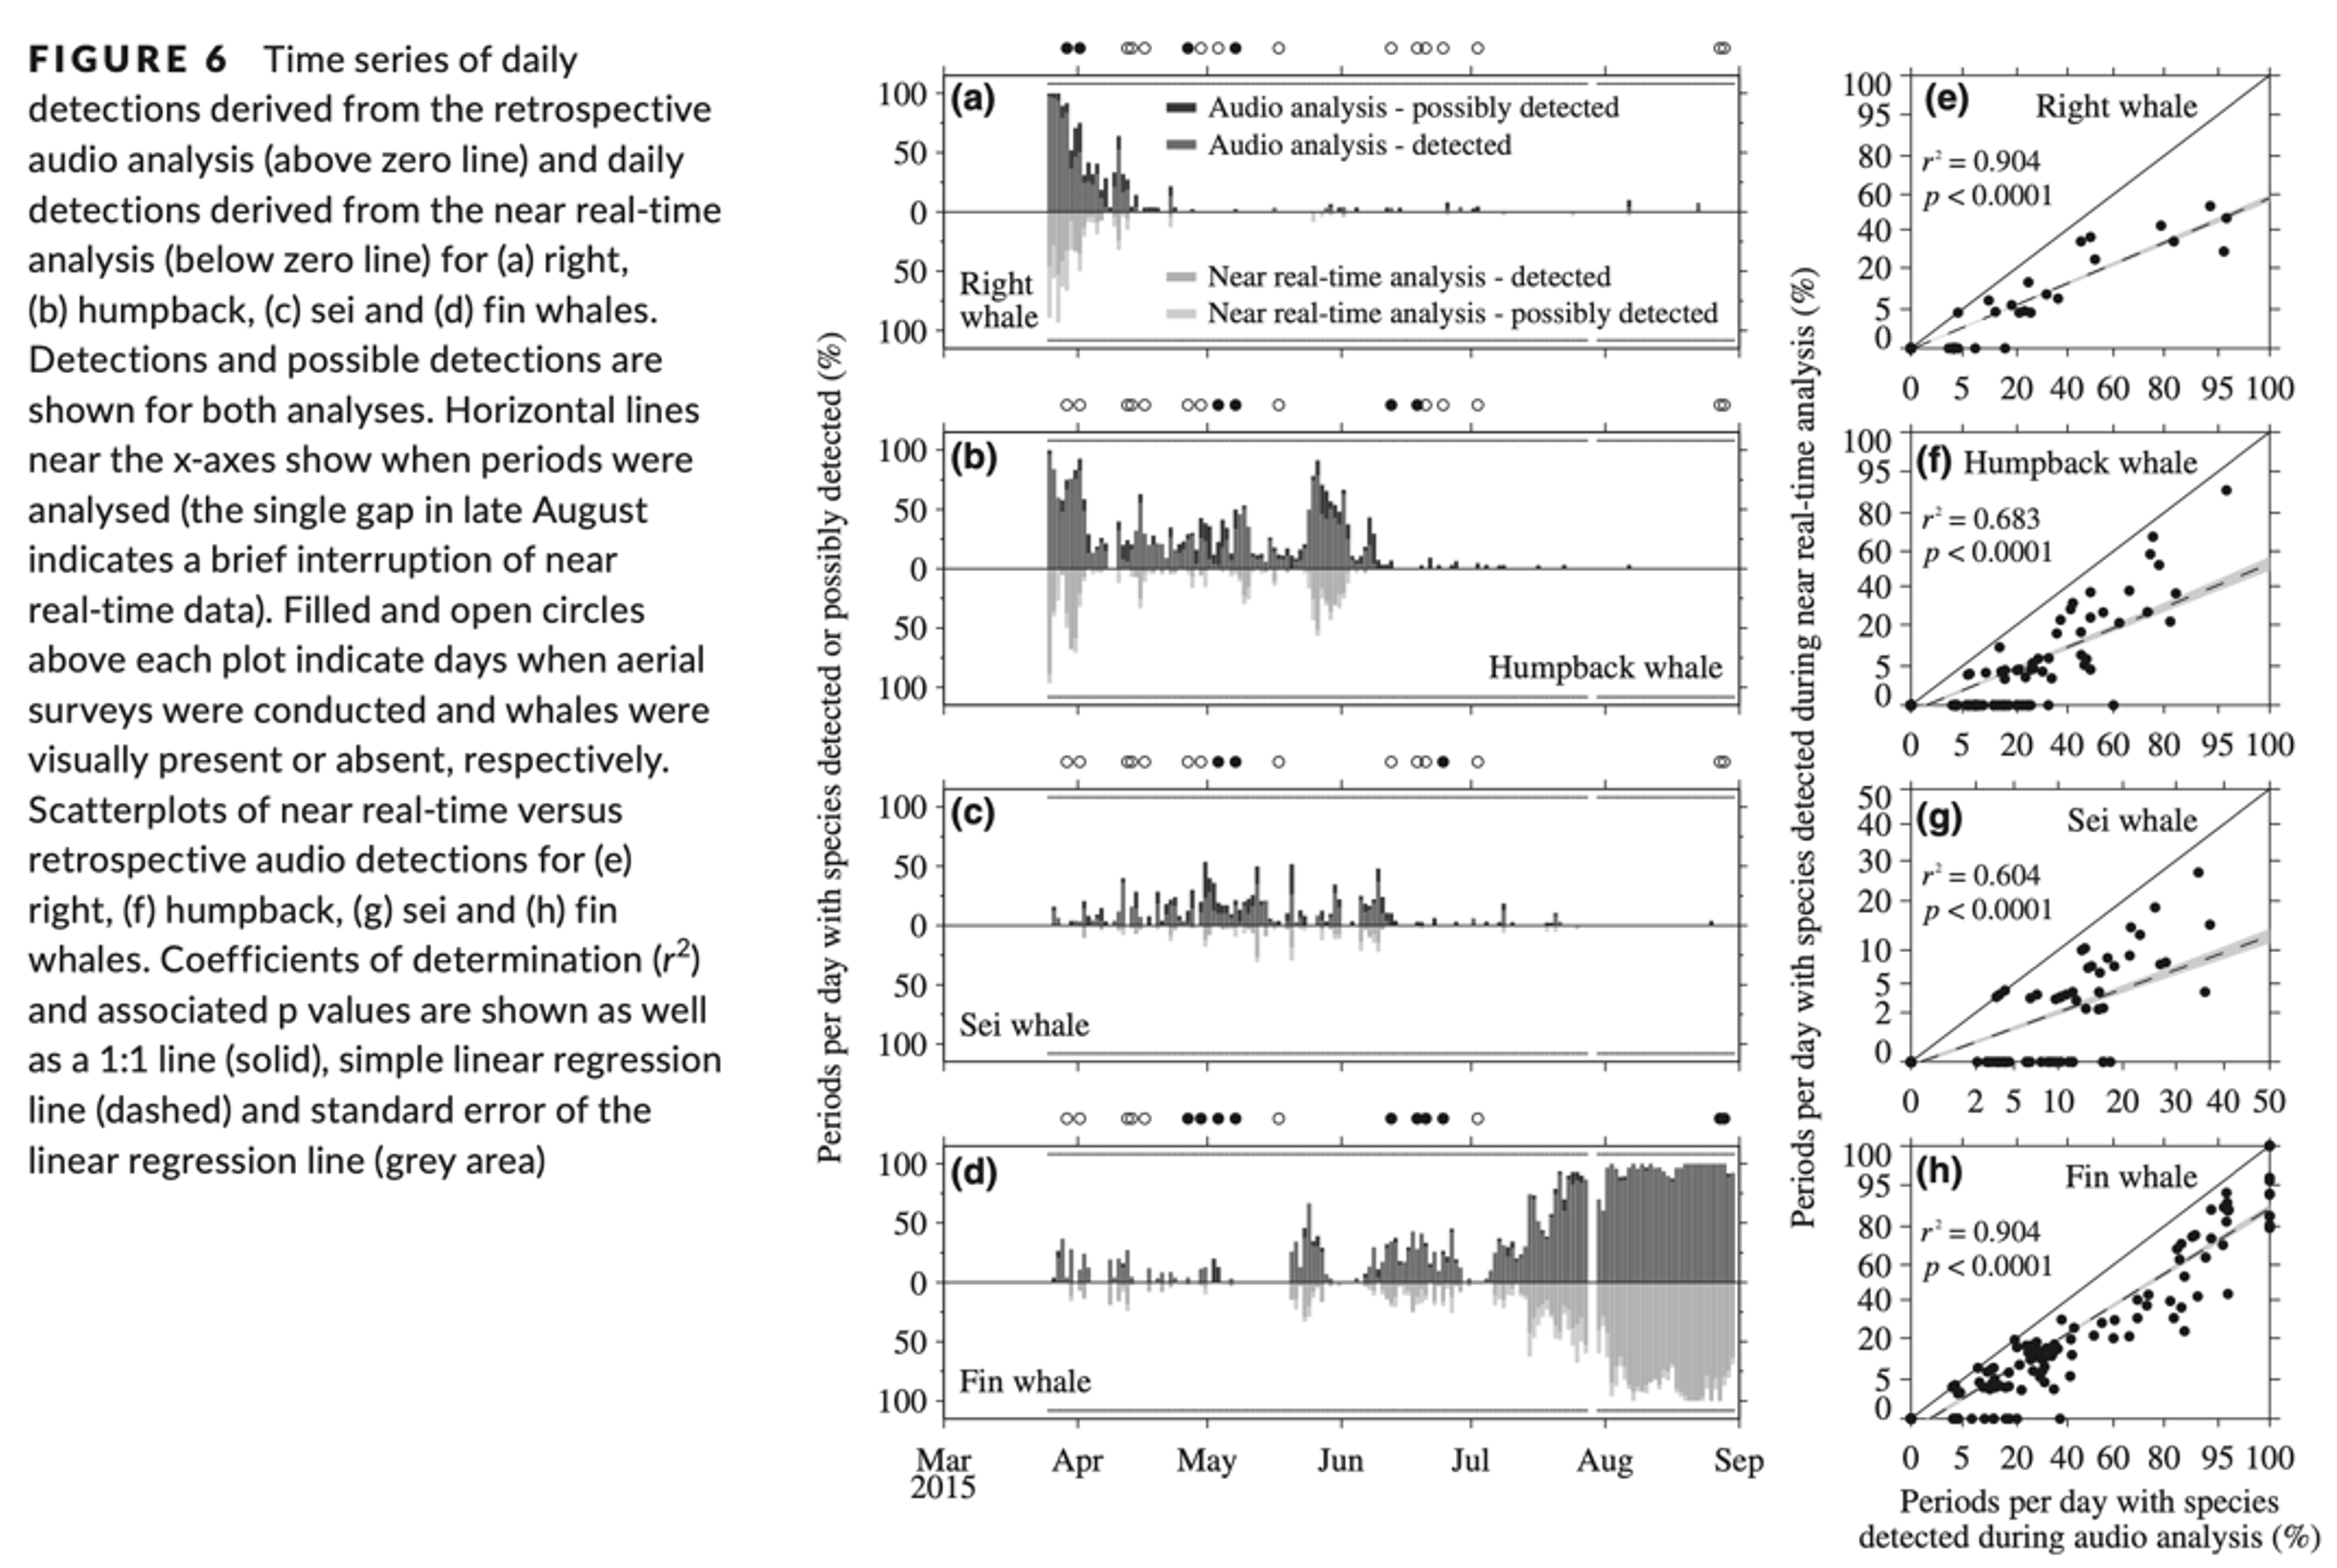
To be meaningful for assessing patterns and changes over time, species detection data usually needs to be further summarized beyond a simple time series of detections and locations described previously. Summary metrics can be presented as time series via graphs or other plots, or as maps. Some common summary metrics include:
Percent of each day with species detected or possibly detected (graphed over entire monitoring period)
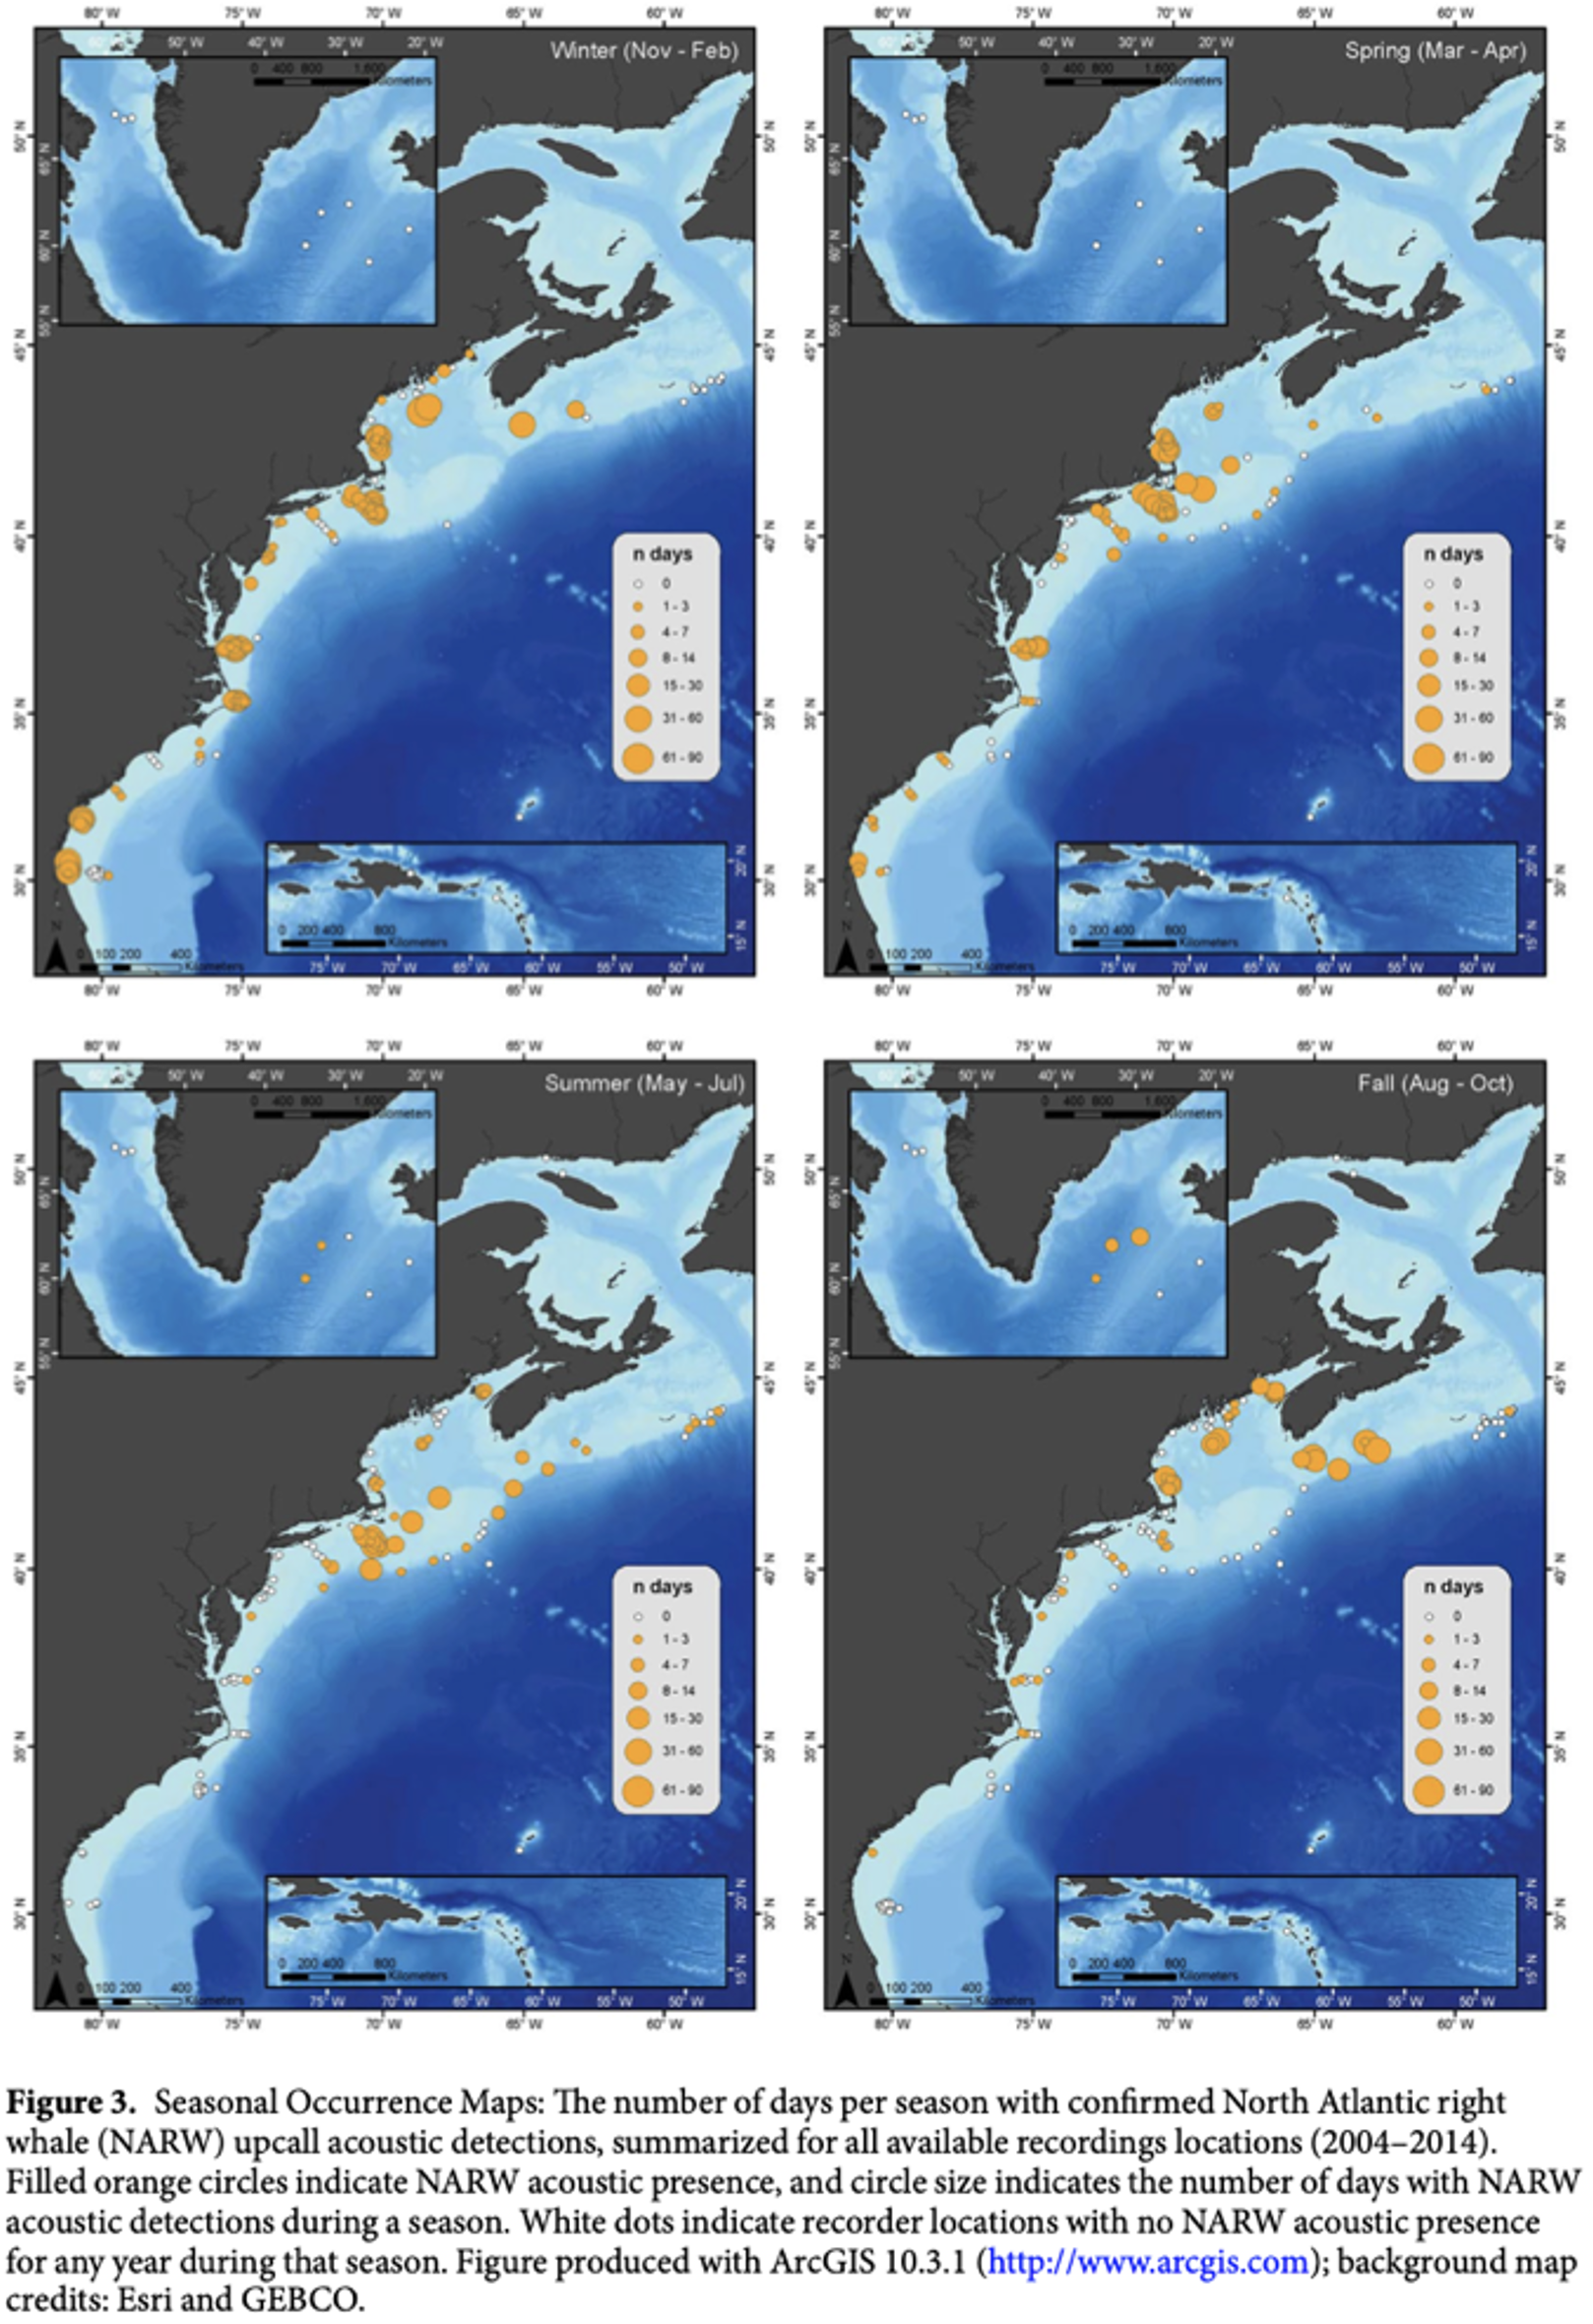
Proportion of total days monitored with species detected or possibly detected (mapped in geographic space or graphed over time)
See examples of visualizations of these and other metrics in @appendixa.
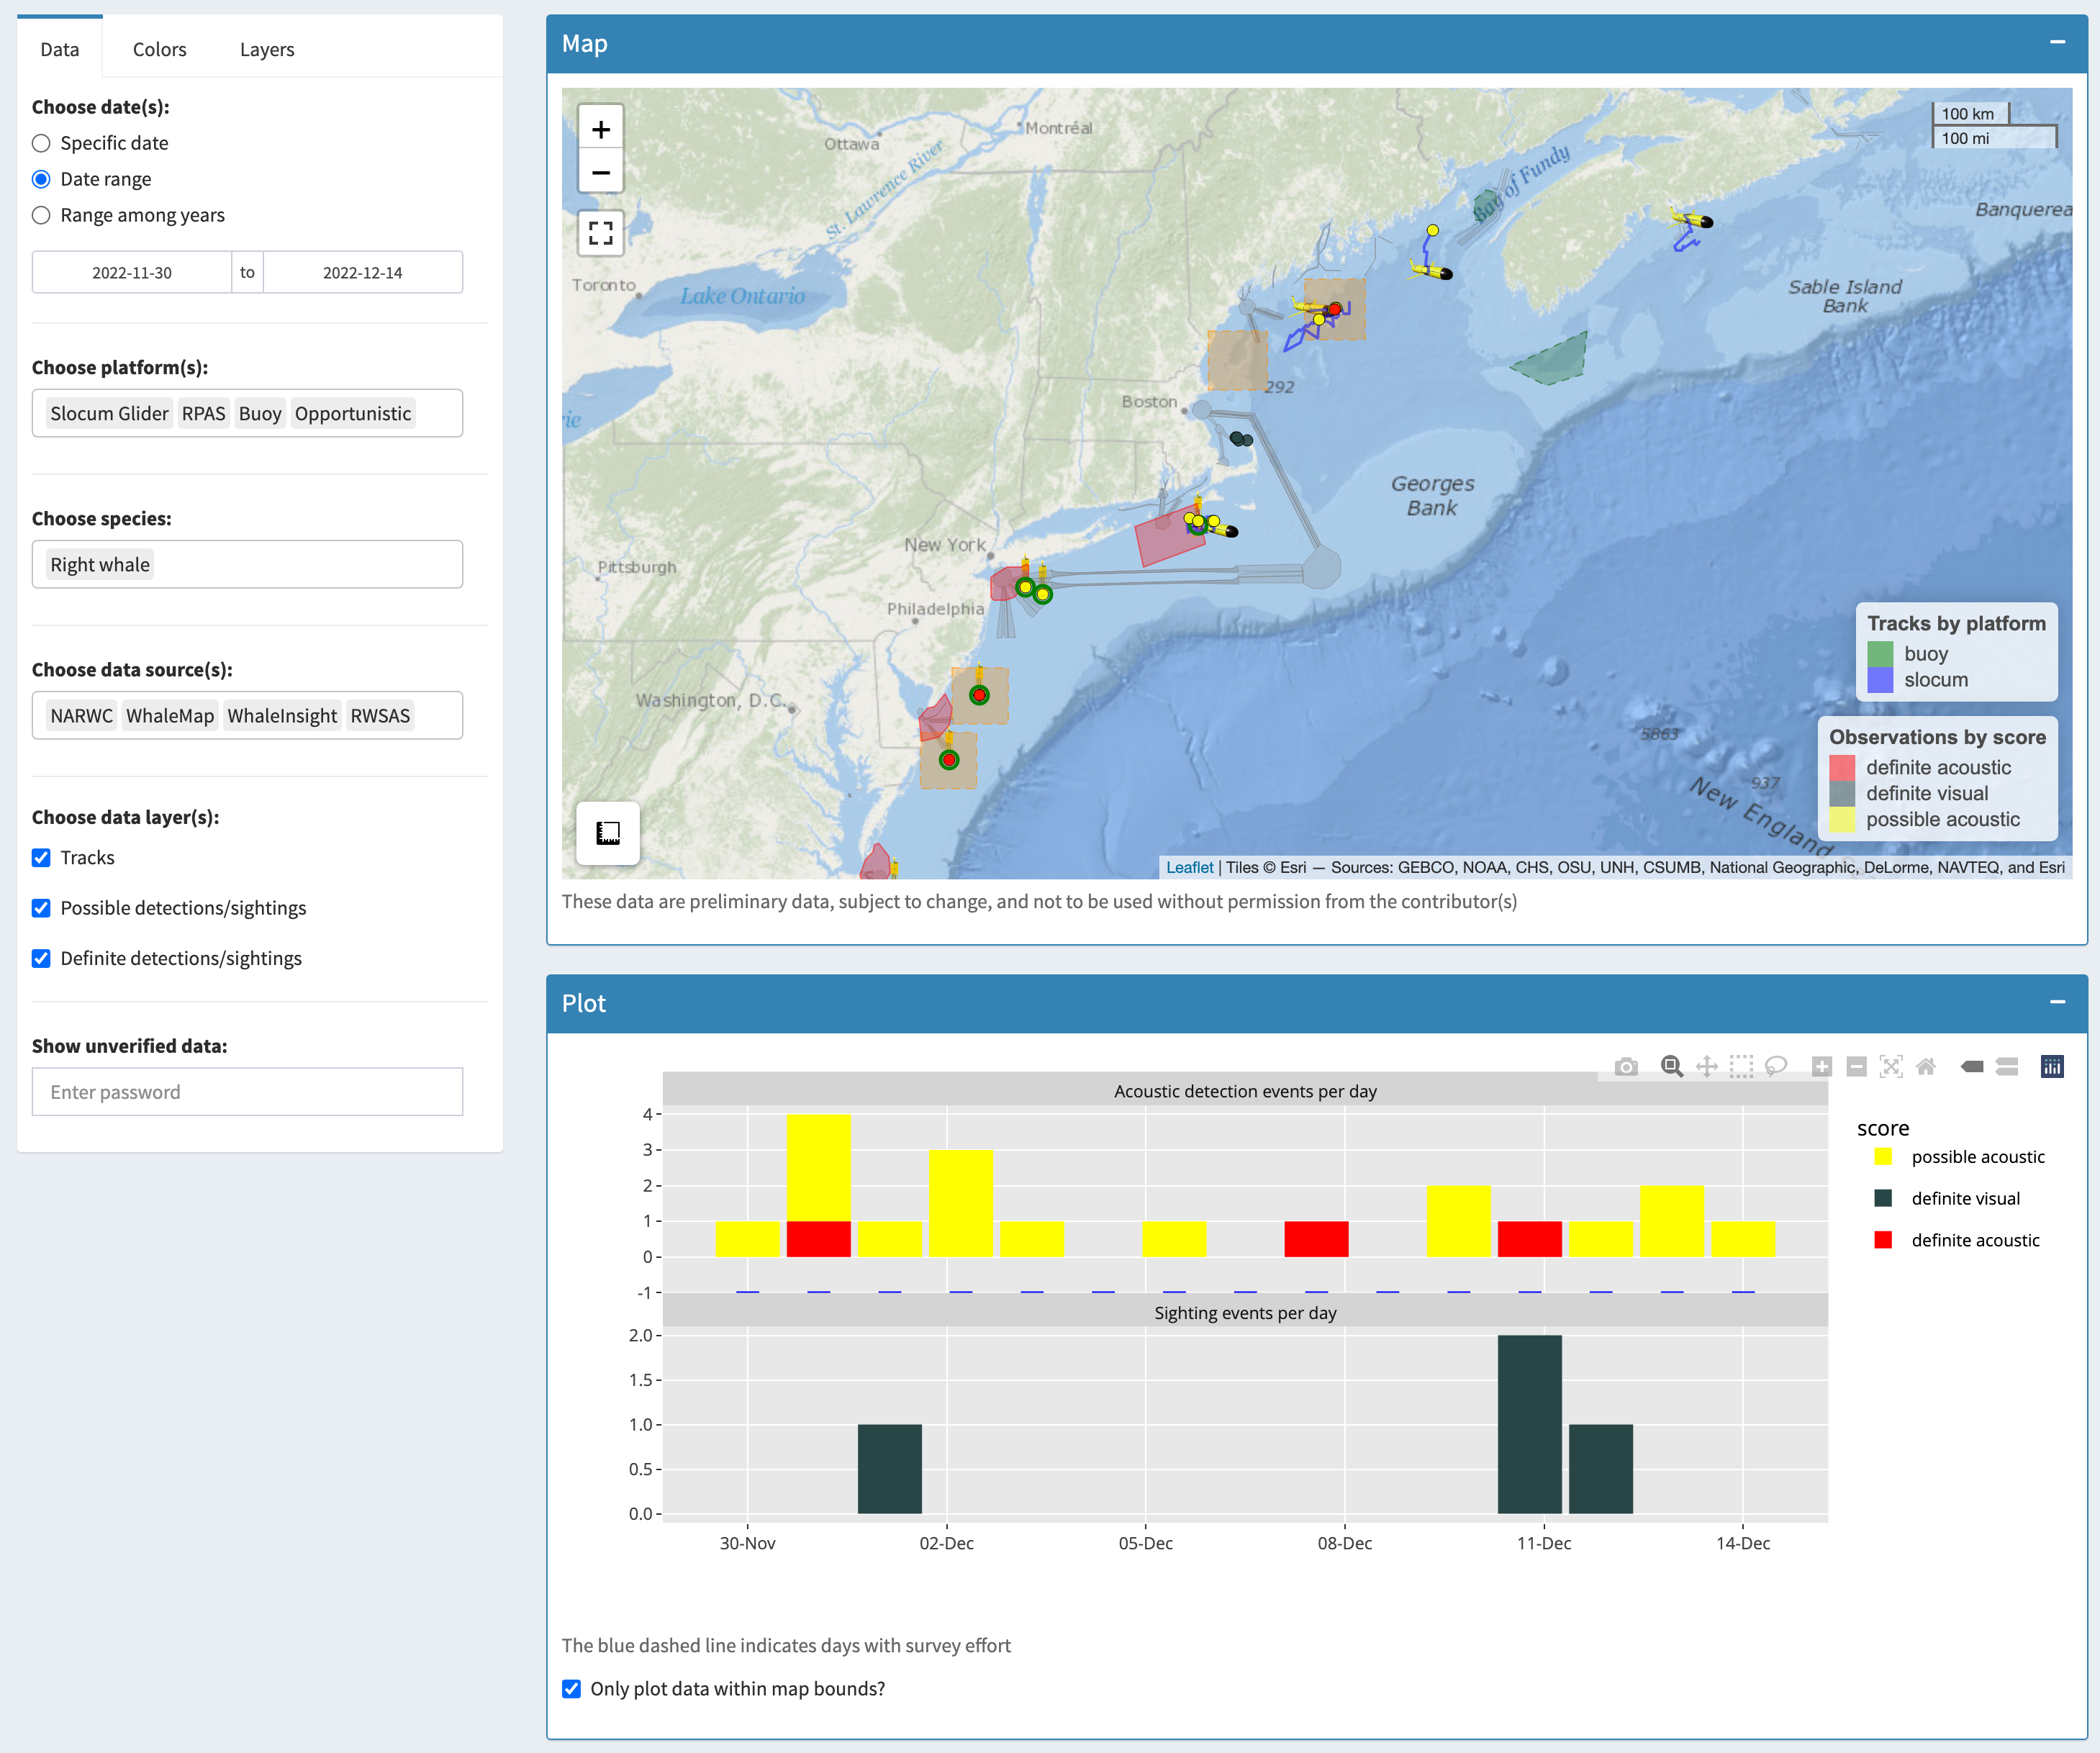
The Subcommittee encourages PAM detections to be shared across widely used and recognized platforms and regional web portals. Some of these efforts on the U.S. Atlantic coast include the Passive Acoustic Cetacean Map (described throughout this document), WhaleMap, and WhaleAlert.
As data are collected, analyzed, and interpreted, the Subcommittee may recommend the development of a standard set of spatial PAM data products to be updated regularly, used to assess changes in detection over time, and disseminated via the appropriate data portals.
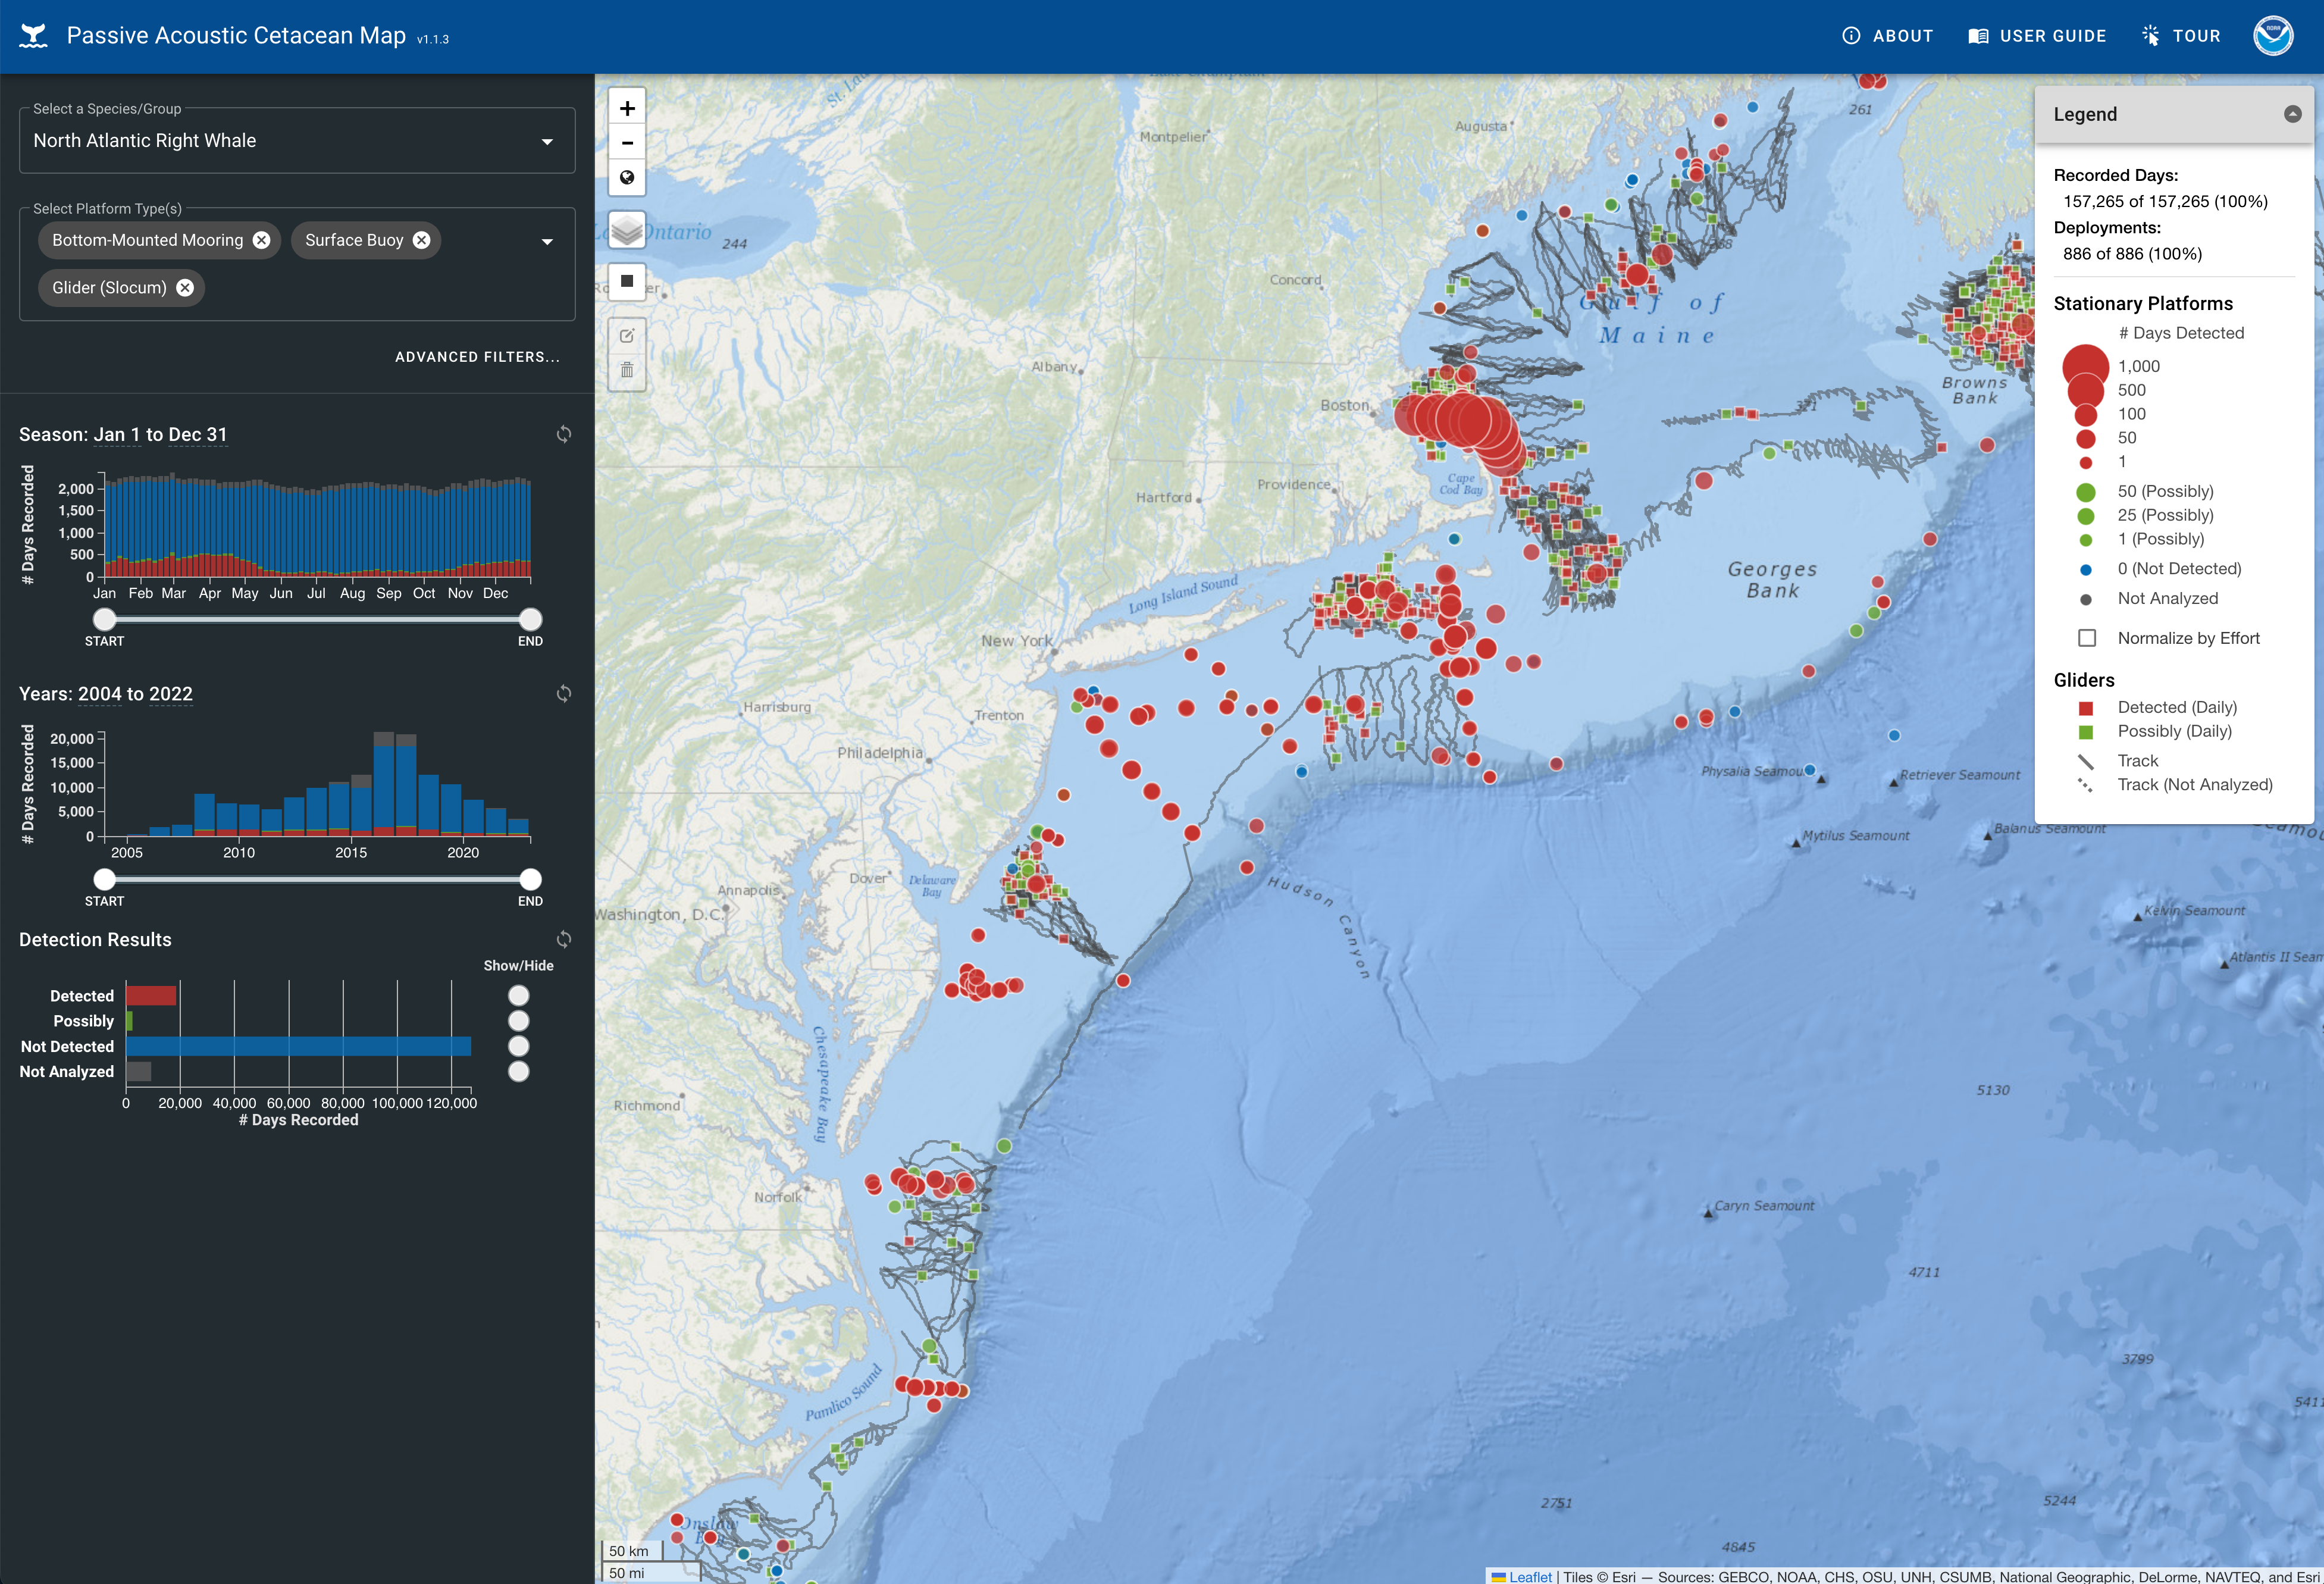
Appendix A: Examples of PAM species detection data visualizations
North Atlantic Right Whale detections on the Passive Acoustic Cetacean Map from the NOAA NEFSC Passive Acoustics Research Group – accessed 12/14/22; https://apps-nefsc.fisheries.noaa.gov/pacm/#/narw.
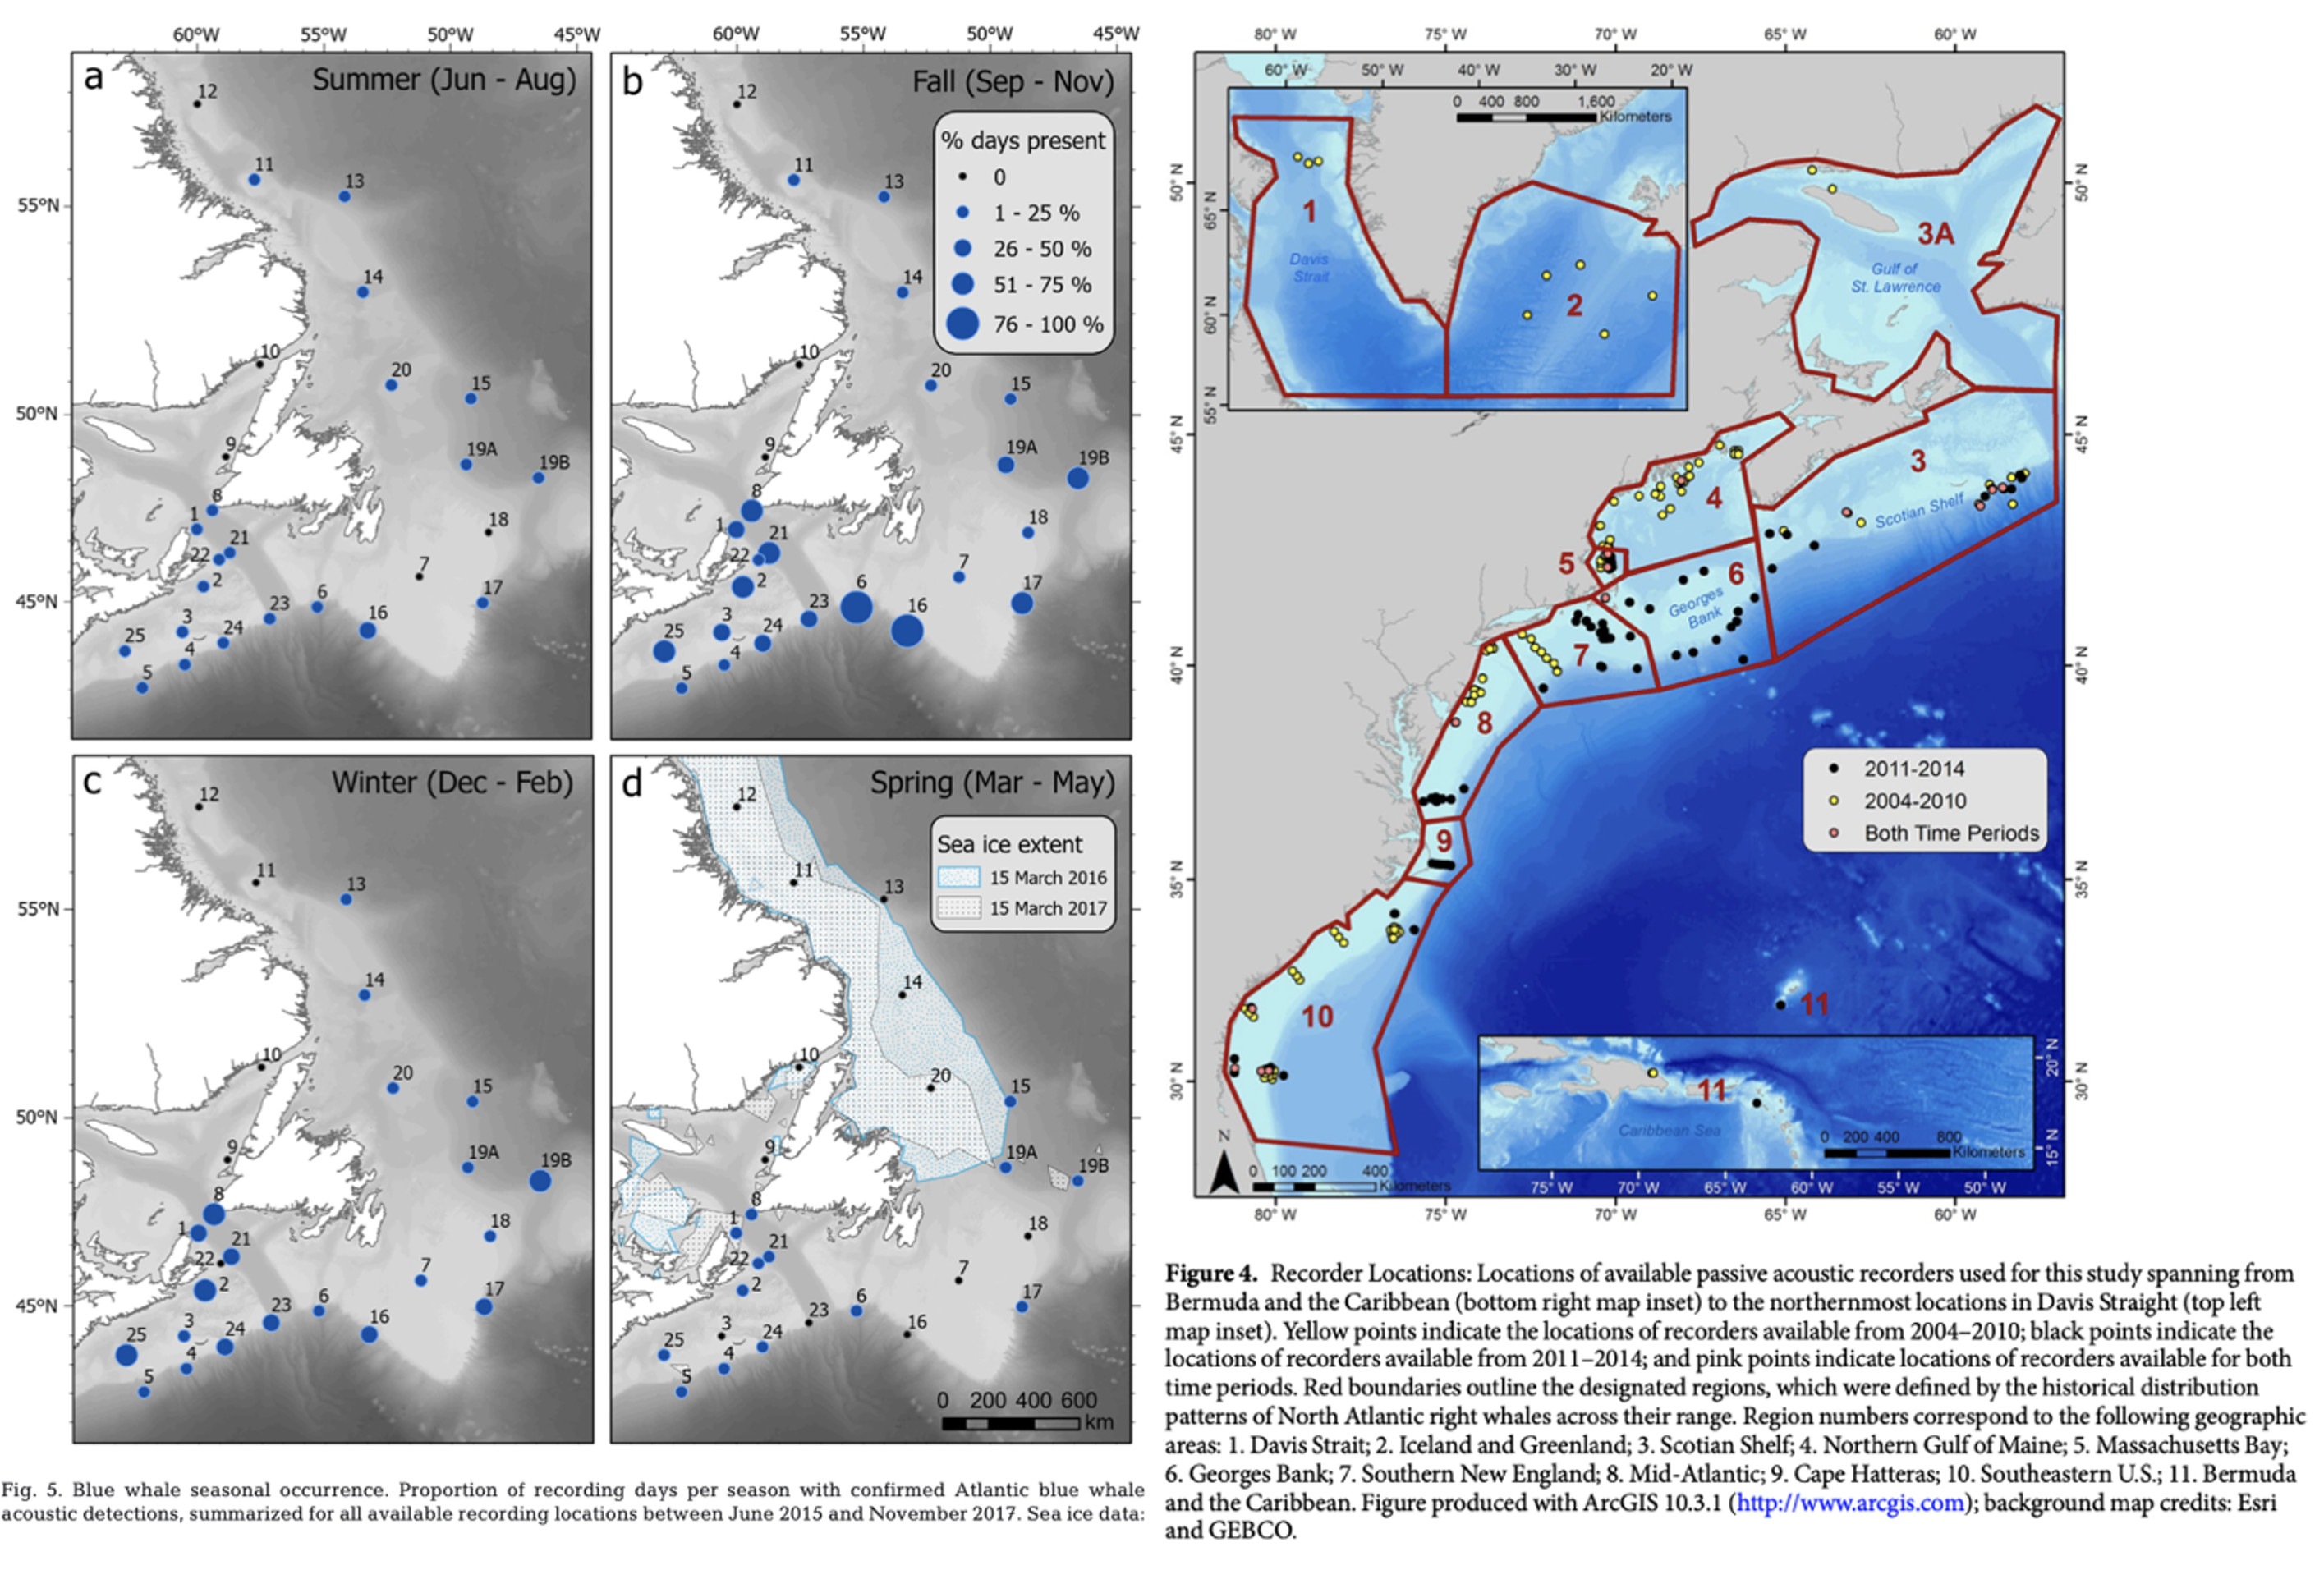
Delarue, Julien J-Y., et al. “Acoustic occurrence of baleen whales, particularly blue, fin, and humpback whales, off eastern Canada, 2015-2017.” Endangered Species Research47 (2022): 265-289.
Baumgartner, Mark F., et al. “Persistent near real‐time passive acoustic monitoring for baleen whales from a moored buoy: System description and evaluation.” Methods in Ecology and Evolution 10.9 (2019): 1476-1489.
Davis, Genevieve E., et al. “Long-term passive acoustic recordings track the changing distribution of North Atlantic right whales (Eubalaena glacialis) from 2004 to 2014.” Scientific reports 7.1 (2017): 1-12.